# Technical Document Analysis of Image
## 1. **Title and Labels**
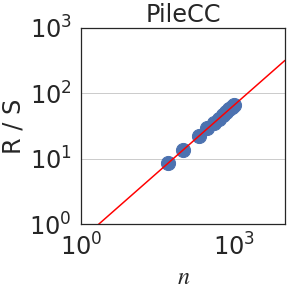
- **Title**: "PileCC" (centered at the top of the plot).
- **X-axis Label**: "n" (logarithmic scale, ranging from $10^0$ to $10^3$).
- **Y-axis Label**: "R/S" (logarithmic scale, ranging from $10^0$ to $10^3$).
## 2. **Chart Components**
- **Data Points**:
- **Color**: Blue (circular markers).
- **Distribution**: Clustered along the red trend line, with values concentrated between $n = 10^1$ and $n = 10^3$ on the x-axis, and $R/S = 10^1$ to $10^2$ on the y-axis.
- **Trend Line**:
- **Color**: Red (solid line).
- **Slope**: Positive (indicating a direct relationship between $n$ and $R/S$).
- **Equation**: Not explicitly provided, but the line passes through the origin and extends diagonally across the plot.
## 3. **Key Trends**
- **Log-Log Scale**: Both axes use a logarithmic scale, suggesting a power-law relationship between $n$ and $R/S$.
- **Data Alignment**: The blue data points closely follow the red trend line, indicating a strong correlation.
- **Slope Interpretation**: The upward slope of the red line implies that $R/S$ increases proportionally with $n$ on a logarithmic scale.
## 4. **Legend and Color Matching**
- **Legend**: No explicit legend is present in the image. However, the red line (trend) and blue data points are visually distinct, with no ambiguity in color coding.
## 5. **Spatial Grounding**
- **Legend Position**: Not applicable (no legend exists).
- **Data Point Placement**: Blue dots are distributed along the red trend line, with no outliers.
## 6. **Trend Verification**
- **Line A (Red)**: Slopes upward, confirming a positive correlation between $n$ and $R/S$.
- **Data Series (Blue Dots)**: Aligns with the trend line, reinforcing the observed relationship.
## 7. **Component Isolation**
- **Header**: "PileCC" (title).
- **Main Chart**: Scatter plot with log-log axes, red trend line, and blue data points.
- **Footer**: No additional text or components.
## 8. **Textual Information**
- **Transcribed Text**:
- "PileCC" (title).
- "R/S" (y-axis label).
- "n" (x-axis label).
## 9. **Additional Notes**
- **No Data Table**: The image does not contain a data table; only a scatter plot with a trend line is present.
- **Language**: All text is in English. No other languages are present.
## 10. **Conclusion**
The image depicts a log-log scatter plot titled "PileCC," showing a positive correlation between $n$ (x-axis) and $R/S$ (y-axis). The red trend line indicates a power-law relationship, with blue data points closely following the line. No legend or additional textual elements are present.