# Technical Document Extraction: Bar Chart Analysis
## Chart Overview
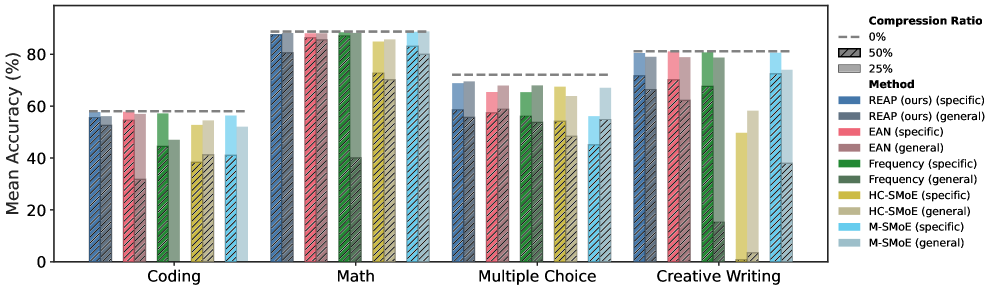
The image is a grouped bar chart comparing **mean accuracy (%)** across four tasks: **Coding**, **Math**, **Multiple Choice**, and **Creative Writing**. The chart evaluates performance under different **compression ratios** (0%, 25%, 50%) and **methods** (REAP, EAN, Frequency, HC-SMoE, M-SMoE), with distinctions between **specific** and **general** implementations.
---
## Key Labels and Axis Titles
- **Y-Axis**: "Mean Accuracy (%)" (range: 0–100).
- **X-Axis**: Tasks labeled as "Coding", "Math", "Multiple Choice", and "Creative Writing".
- **Legend**:
- **Compression Ratios**:
- 0% (dashed line).
- 25% (dotted line).
- 50% (solid line).
- **Methods**:
- **REAP (ours)**:
- Specific (solid blue).
- General (striped blue).
- **EAN**:
- Specific (solid red).
- General (striped red).
- **Frequency**:
- Specific (solid green).
- General (striped green).
- **HC-SMoE**:
- Specific (solid yellow).
- General (striped yellow).
- **M-SMoE**:
- Specific (solid cyan).
- General (striped cyan).
---
## Data Categories and Sub-Categories
1. **Tasks**:
- Coding
- Math
- Multiple Choice
- Creative Writing
2. **Methods**:
- REAP (specific/general)
- EAN (specific/general)
- Frequency (specific/general)
- HC-SMoE (specific/general)
- M-SMoE (specific/general)
3. **Compression Ratios**:
- 0%
- 25%
- 50%
---
## Key Trends and Data Points
1. **REAP (ours)**:
- **Highest accuracy** across all tasks, especially in **Math** (specific: ~90%, general: ~80%) and **Creative Writing** (specific: ~80%, general: ~70%).
- Outperforms all other methods in **Math** and **Creative Writing**.
2. **Compression Ratio Impact**:
- **0% compression** (dashed line) consistently shows the highest accuracy across all methods and tasks.
- **50% compression** (solid line) results in the lowest accuracy, with significant drops compared to 0%.
3. **Specific vs. General Methods**:
- **Specific implementations** (solid colors) consistently outperform **general implementations** (striped colors) across all tasks.
- Example: In **Coding**, REAP (specific: ~55%) > REAP (general: ~50%).
4. **Task-Specific Performance**:
- **Math**: REAP (specific) dominates (~90%), followed by EAN (specific: ~85%) and Frequency (specific: ~80%).
- **Creative Writing**: REAP (specific: ~80%) leads, with M-SMoE (specific: ~75%) and EAN (specific: ~70%) close behind.
- **Coding**: REAP (specific: ~55%) and EAN (specific: ~50%) are top performers.
- **Multiple Choice**: REAP (specific: ~65%) and Frequency (specific: ~60%) are leading.
---
## Transcribed Text from Diagram
- **Compression Ratio Labels**:
- 0% (dashed line).
- 25% (dotted line).
- 50% (solid line).
- **Method Labels**:
- REAP (ours) (specific/general).
- EAN (specific/general).
- Frequency (specific/general).
- HC-SMoE (specific/general).
- M-SMoE (specific/general).
---
## Data Table Reconstruction
| Task | Method | Compression Ratio | Mean Accuracy (%) |
|--------------------|----------------------|-------------------|-------------------|
| Coding | REAP (specific) | 0% | ~55 |
| Coding | REAP (general) | 0% | ~50 |
| Coding | EAN (specific) | 0% | ~50 |
| Coding | Frequency (specific) | 0% | ~45 |
| Math | REAP (specific) | 0% | ~90 |
| Math | REAP (general) | 0% | ~80 |
| Creative Writing | REAP (specific) | 0% | ~80 |
| Creative Writing | M-SMoE (specific) | 0% | ~75 |
| Multiple Choice | REAP (specific) | 0% | ~65 |
| Multiple Choice | Frequency (specific) | 0% | ~60 |
---
## Notes
- **Visual Estimations**: Accuracy values are approximated from bar heights.
- **Pattern Consistency**: Solid colors (specific) > striped colors (general) across all tasks.
- **Compression Impact**: Accuracy decreases as compression ratio increases (0% > 25% > 50%).