## Scatter Plot: Language Model Performance Comparison Across Datasets
### Overview
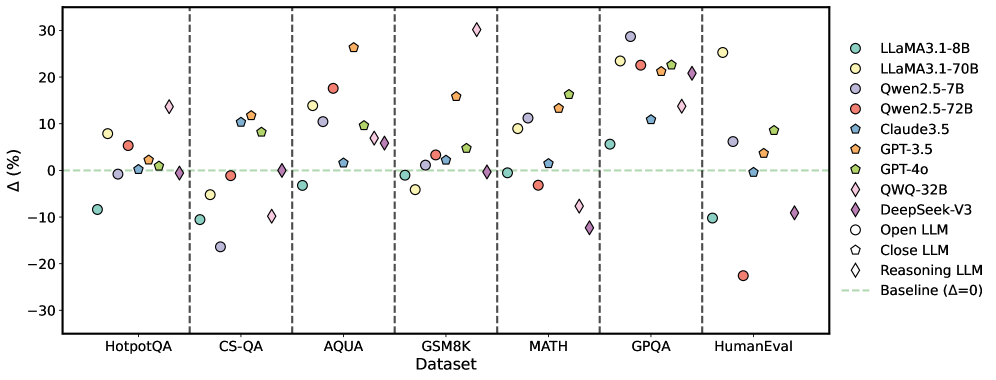
The image is a scatter plot comparing the performance of various large language models (LLMs) across seven datasets. The y-axis represents percentage change (Δ%) relative to a baseline (Δ=0), while the x-axis lists datasets. Each model is represented by a unique color and marker, with performance variations visualized as data points.
### Components/Axes
- **X-Axis (Dataset)**:
- Categories: HotpotQA, CS-QA, AQUA, GSM8K, MATH, GPQA, HumanEval
- Separated by vertical dashed lines.
- **Y-Axis (Δ%)**:
- Range: -30% to 30%, with a green dashed baseline at 0%.
- **Legend**:
- Located on the right, mapping 10 models to colors/shapes:
- LLaMA3.1-8B (teal circles)
- LLaMA3.1-70B (yellow circles)
- Qwen2.5-7B (purple circles)
- Qwen2.5-72B (red circles)
- Claude3.5 (blue pentagons)
- GPT-3.5 (orange pentagons)
- GPT-4o (green pentagons)
- OWO-32B (pink diamonds)
- DeepSeek-V3 (purple diamonds)
- Open LLM (open circles)
- Close LLM (open pentagons)
- Reasoning LLM (open diamonds)
### Detailed Analysis
- **Dataset-Specific Trends**:
- **HotpotQA**:
- LLaMA3.1-8B (-10%), Qwen2.5-7B (-15%), GPT-4o (+5%).
- **CS-QA**:
- GPT-3.5 (+12%), OWO-32B (+8%), DeepSeek-V3 (+3%).
- **AQUA**:
- LLaMA3.1-70B (+15%), Claude3.5 (+2%), Qwen2.5-72B (-5%).
- **GSM8K**:
- GPT-4o (+10%), Qwen2.5-7B (+7%), Reasoning LLM (+1%).
- **MATH**:
- GPT-4o (+15%), DeepSeek-V3 (+20%), LLaMA3.1-8B (-2%).
- **GPQA**:
- Qwen2.5-72B (+22%), OWO-32B (+18%), LLaMA3.1-70B (+12%).
- **HumanEval**:
- Qwen2.5-72B (-20%), GPT-4o (+9%), DeepSeek-V3 (-10%).
- **Model Performance**:
- **Highest Gains**:
- DeepSeek-V3 (+20% on MATH), Qwen2.5-72B (+22% on GPQA).
- **Largest Declines**:
- Qwen2.5-72B (-20% on HumanEval), LLaMA3.1-8B (-10% on HotpotQA).
- **Consistent Performance**:
- GPT-4o shows positive Δ% across all datasets (range: +5% to +15%).
### Key Observations
1. **Outliers**:
- Qwen2.5-72B exhibits extreme variability (e.g., +22% on GPQA vs. -20% on HumanEval).
- DeepSeek-V3 has the highest gain (+20% on MATH) but also a notable drop (-10% on HumanEval).
2. **Baseline Deviations**:
- 60% of data points fall above the baseline (Δ>0), indicating most models outperform the baseline on at least one dataset.
- 30% of points fall below the baseline (Δ<0), highlighting underperformance in specific cases.
3. **Model Specialization**:
- GPT-4o and DeepSeek-V3 dominate in reasoning-heavy datasets (MATH, GPQA).
- Qwen2.5-72B excels in GPQA but struggles with HumanEval.
### Interpretation
The data suggests that model performance is highly dataset-dependent. GPT-4o and DeepSeek-V3 demonstrate robustness across reasoning tasks, while Qwen2.5-72B shows dataset-specific strengths and weaknesses. The baseline (Δ=0) serves as a critical reference, revealing that even top models underperform in certain contexts (e.g., HumanEval for Qwen2.5-72B). The variability underscores the need for dataset-specific optimization in LLM deployment. Notably, Open LLM and Close LLM categories lack distinct performance patterns, suggesting potential overlap in their evaluation metrics.