\n
## Scatter Plot: Performance Comparison of Large Language Models
### Overview
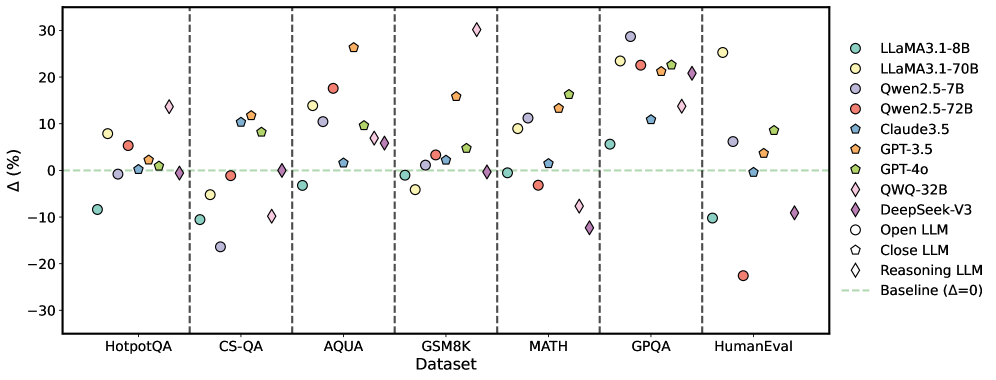
This scatter plot compares the performance of various Large Language Models (LLMs) across seven different datasets. The y-axis represents the performance difference (Δ) in percentage points, while the x-axis lists the datasets used for evaluation. The plot uses different marker shapes and colors to distinguish between the LLMs. A horizontal dashed line at Δ=0 serves as a baseline for comparison.
### Components/Axes
* **X-axis:** Dataset - with the following categories: HotpotQA, CS-QA, AQUA, GSM8K, MATH, GPQA, HumanEval.
* **Y-axis:** Δ (%) - Represents the percentage point difference in performance relative to a baseline. The scale ranges from approximately -30% to 30%.
* **Legend:** Located in the top-right corner, identifies each LLM with a corresponding color and marker shape. The legend includes:
* LLaMA3.1-8B (Purple Circle)
* LLaMA3.1-70B (Yellow Circle)
* Qwen2.5-7B (Light Blue Circle)
* Qwen2.5-72B (Red Circle)
* Claude3.5 (Dark Blue Triangle)
* GPT-3.5 (Orange Triangle)
* GPT-4o (Green Diamond)
* QWQ-32B (Brown Diamond)
* DeepSeek-V3 (Magenta Diamond)
* Open LLM (White Circle)
* Close LLM (Light Grey Hexagon)
* Reasoning LLM (Black Diamond)
* Baseline (Δ=0) (Black Dashed Line)
### Detailed Analysis
The plot shows the performance variation of each LLM across the datasets. The following observations are made:
* **HotpotQA:** Performance varies significantly. LLaMA3.1-70B shows the highest positive Δ (approximately +20%), while Qwen2.5-72B shows a negative Δ (approximately -10%).
* **CS-QA:** LLaMA3.1-70B and Qwen2.5-72B show positive Δ values (around +10% to +15%), while other models are closer to the baseline.
* **AQUA:** GPT-4o and DeepSeek-V3 show the highest positive Δ values (around +20% to +25%). Qwen2.5-7B and Qwen2.5-72B show negative Δ values (around -5% to -10%).
* **GSM8K:** GPT-4o and DeepSeek-V3 show the highest positive Δ values (around +20% to +25%). Qwen2.5-72B shows a negative Δ value (around -15%).
* **MATH:** GPT-4o and DeepSeek-V3 show the highest positive Δ values (around +20% to +30%). Qwen2.5-72B shows a negative Δ value (around -20%).
* **GPQA:** LLaMA3.1-70B and DeepSeek-V3 show the highest positive Δ values (around +15% to +25%). Qwen2.5-72B shows a negative Δ value (around -10%).
* **HumanEval:** GPT-4o shows the highest positive Δ value (around +20%). Qwen2.5-72B shows a negative Δ value (around -20%).
**Specific Data Points (Approximate):**
* **LLaMA3.1-8B:** Δ values range from approximately -5% to +15% across datasets.
* **LLaMA3.1-70B:** Δ values range from approximately -5% to +20% across datasets.
* **Qwen2.5-7B:** Δ values range from approximately -10% to +10% across datasets.
* **Qwen2.5-72B:** Δ values range from approximately -20% to +15% across datasets.
* **Claude3.5:** Δ values range from approximately -5% to +10% across datasets.
* **GPT-3.5:** Δ values range from approximately -5% to +10% across datasets.
* **GPT-4o:** Δ values range from approximately +10% to +30% across datasets.
* **QWQ-32B:** Δ values range from approximately -5% to +15% across datasets.
* **DeepSeek-V3:** Δ values range from approximately +10% to +25% across datasets.
### Key Observations
* GPT-4o and DeepSeek-V3 consistently outperform other models across most datasets, exhibiting the largest positive Δ values.
* Qwen2.5-72B frequently shows negative Δ values, indicating underperformance compared to the baseline.
* LLaMA3.1-70B generally performs better than LLaMA3.1-8B.
* The performance differences between models are dataset-dependent.
### Interpretation
The data suggests that GPT-4o and DeepSeek-V3 are currently the most capable LLMs among those tested, demonstrating superior performance across a diverse range of tasks represented by the datasets. The consistent negative Δ values for Qwen2.5-72B indicate that this model may require further optimization or is less suited for the evaluated tasks. The variation in performance across datasets highlights the importance of task-specific evaluation when comparing LLMs. The plot provides a valuable comparative analysis of LLM capabilities, enabling informed decisions regarding model selection for specific applications. The baseline (Δ=0) is crucial for understanding whether a model is providing an improvement over a standard approach. The distinction between "Open LLM", "Close LLM", and "Reasoning LLM" suggests a categorization of models based on their architecture or training methodology, but the plot doesn't directly reveal how these categories correlate with performance.