## Diagram: Knowledge Graph Poisoning Attack
### Overview
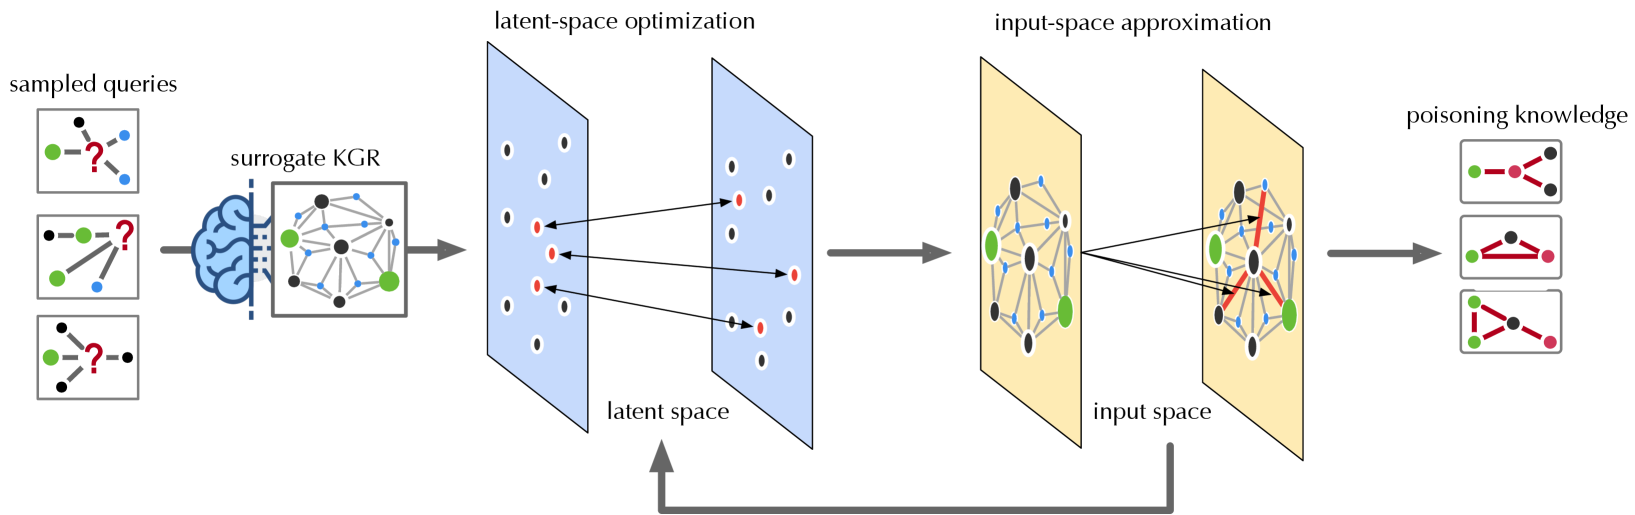
The image illustrates a knowledge graph poisoning attack process. It starts with sampled queries, proceeds through a surrogate knowledge graph representation (KGR), latent-space optimization, input-space approximation, and culminates in poisoning knowledge. The diagram shows how the attack manipulates the knowledge graph to introduce false or misleading information.
### Components/Axes
* **sampled queries:** Three example queries are shown, each consisting of nodes (black, green, blue) and edges. Each query has a red question mark indicating an unknown relationship.
* **surrogate KGR:** A brain icon is connected to a knowledge graph representation. The graph consists of nodes (black, green, blue) and edges.
* **latent-space optimization:** Two blue planes represent the latent space. The left plane has black and red nodes. The right plane has black and red nodes. Arrows connect some nodes between the two planes. The text "latent space" is below the planes.
* **input-space approximation:** Two yellow planes represent the input space. The left plane has black, green, and blue nodes connected by gray edges. The right plane has black, green, and blue nodes connected by gray edges, with some red edges. Arrows connect some nodes between the two planes. The text "input space" is below the planes.
* **poisoning knowledge:** Three example poisoned knowledge graphs are shown, each consisting of nodes (black, green, red) and edges.
* A gray arrow loops from the right yellow plane (input space) back to the bottom of the left blue plane (latent space).
### Detailed Analysis
* **sampled queries:**
* Query 1: Contains one black node, one green node, and two blue nodes.
* Query 2: Contains one black node, one green node, and two blue nodes.
* Query 3: Contains two black nodes and one green node.
* **surrogate KGR:** The knowledge graph contains approximately 10 black nodes, 3 green nodes, and 10 blue nodes.
* **latent-space optimization:** The left latent space plane contains approximately 8 black nodes and 4 red nodes. The right latent space plane contains approximately 8 black nodes and 4 red nodes.
* **input-space approximation:** The left input space plane contains approximately 8 black nodes, 3 green nodes, and 10 blue nodes. The right input space plane contains approximately 8 black nodes, 3 green nodes, and 10 blue nodes. The right plane also contains red edges.
* **poisoning knowledge:**
* Graph 1: Contains one green node, one red node, and one black node.
* Graph 2: Contains one green node, one red node, and one black node.
* Graph 3: Contains one green node, two red nodes, and one black node.
### Key Observations
* The process starts with incomplete queries and uses a surrogate KGR to generate a latent space representation.
* The latent space is optimized and approximated back to the input space, where poisoning is introduced by adding red edges.
* The final output is a set of poisoned knowledge graphs with altered relationships (red edges).
* The gray arrow indicates a feedback loop from the input space to the latent space.
### Interpretation
The diagram illustrates a method for injecting false information into a knowledge graph. The process involves transforming the initial queries into a latent space, optimizing this space, and then approximating it back to the input space. The key step is the introduction of "poisoning knowledge" in the input space, represented by the red edges. This suggests that the attack focuses on manipulating the relationships between entities in the knowledge graph. The feedback loop from the input space to the latent space implies an iterative refinement of the poisoning strategy. The goal is to create poisoned knowledge graphs that can mislead users or downstream applications that rely on the knowledge graph.