## Diagram: Workflow for Poisoning Knowledge via Latent-Space Optimization and Input-Space Approximation
### Overview
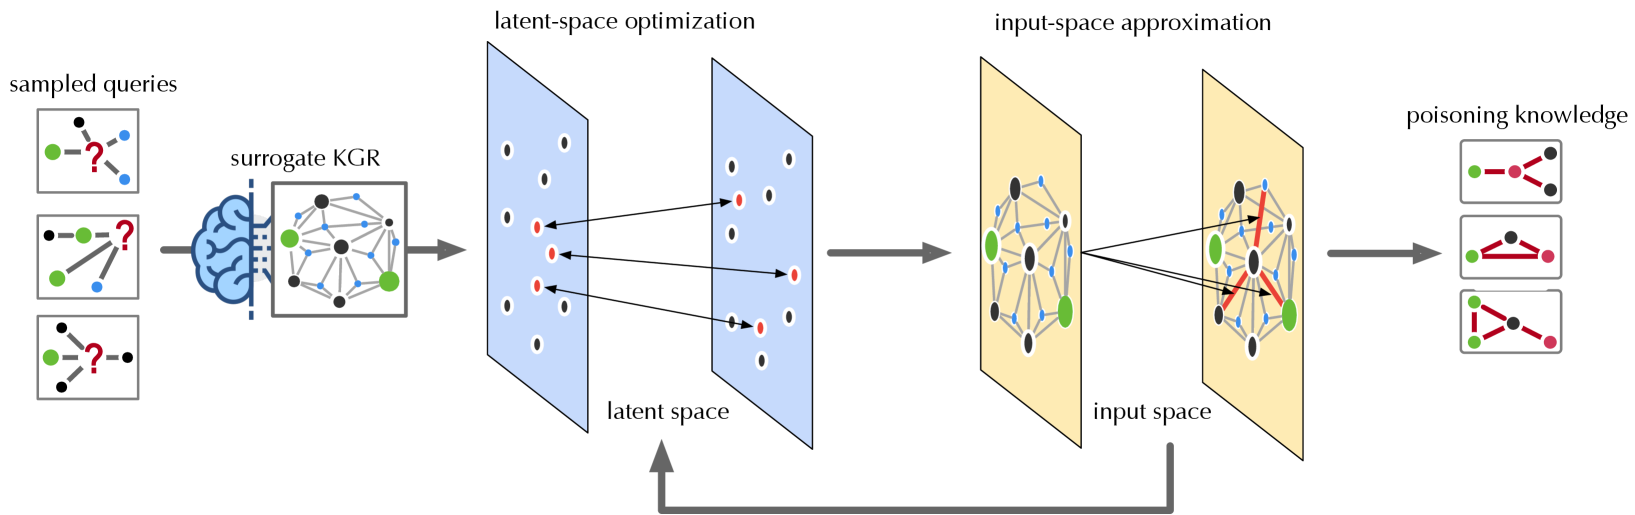
The image depicts a technical workflow diagram illustrating a process for generating "poisoning knowledge" for a Knowledge Graph Reasoning (KGR) system. The process flows from left to right, starting with "sampled queries," passing through a "surrogate KGR" model, undergoing "latent-space optimization," and finally "input-space approximation," with a feedback loop returning to the latent space.
### Components
* **Left Section (Input):** "sampled queries" consisting of three small boxes, each containing a graph structure with a red question mark.
* **Transition:** "surrogate KGR" represented by a brain icon connected to a graph structure.
* **Center Section:** "latent-space optimization" represented by two blue rectangular planes containing scattered data points.
* **Right-Center Section:** "input-space approximation" represented by two yellow rectangular planes containing graph structures.
* **Right Section (Output):** "poisoning knowledge" consisting of three small boxes, each containing a graph structure with red highlighted edges.
* **Feedback Loop:** A thick grey arrow originating from the bottom of the "input-space approximation" section and pointing back to the "latent-space optimization" section.
### Detailed Analysis
#### 1. Sampled Queries (Far Left)
* **Content:** Three stacked boxes.
* **Structure:** Each box contains a graph with a central node (green or black) connected to peripheral nodes (black, green, blue).
* **Feature:** A large red question mark is superimposed over the connections in each graph, indicating missing or unknown information that the system aims to resolve or manipulate.
#### 2. Surrogate KGR (Center-Left)
* **Content:** A stylized brain icon connected to a graph.
* **Structure:** The graph contains nodes of varying sizes (large green, medium black, small blue) connected by thin grey lines. This represents the model being used as a proxy for the target system.
#### 3. Latent-Space Optimization (Center)
* **Content:** Two blue, translucent rectangular planes positioned side-by-side.
* **Data Points:** Both planes contain scattered dots (black with white centers, and red).
* **Flow:** Arrows point from the right blue plane to the left blue plane, specifically targeting the red dots. This suggests an optimization process where the system is refining the latent representation (the red dots) to achieve a specific objective.
#### 4. Input-Space Approximation (Right-Center)
* **Content:** Two yellow, translucent rectangular planes positioned side-by-side.
* **Structure:** Each plane contains a graph.
* **Left Plane:** A standard graph with nodes (green, black, blue) and grey edges.
* **Right Plane:** The same graph structure, but with specific edges highlighted in **thick red lines**.
* **Flow:** Arrows point from the left yellow plane to the right yellow plane, indicating the transformation of the graph structure into the "poisoned" version.
#### 5. Poisoning Knowledge (Far Right)
* **Content:** Three stacked boxes.
* **Structure:** Each box contains a graph similar to the "sampled queries" but with specific connections highlighted in **thick red lines**.
* **Significance:** These red lines represent the "poisoned" knowledge—the specific structural changes injected into the graph to manipulate the model's reasoning.
### Key Observations
* **Iterative Process:** The feedback loop at the bottom indicates that the "input-space approximation" results are fed back into the "latent-space optimization," implying an iterative refinement process to improve the poisoning attack.
* **Color Coding:**
* **Red:** Used consistently to denote the target of the attack (the question marks in the input, the specific dots in latent space, the highlighted edges in the output).
* **Blue/Yellow Planes:** Represent distinct computational spaces (Latent vs. Input).
* **Transformation:** The diagram visually demonstrates the conversion of an unknown query (question mark) into a specific, malicious structural modification (red lines).
### Interpretation
This diagram illustrates an **adversarial machine learning attack** against a Knowledge Graph Reasoning (KGR) model.
1. **The Goal:** The attacker wants to inject "poisoning knowledge" into the graph to manipulate the model's predictions.
2. **The Mechanism:**
* The attacker uses a "surrogate" model (a copy of the target) to simulate how the model reasons.
* They perform optimization in the **latent space** (the model's internal representation) to find the most effective "poison."
* They then map this latent optimization back to the **input space** (the actual graph structure) to determine exactly which edges to add or modify (the red lines).
3. **The Feedback:** The feedback loop suggests that the attacker checks if the approximated input actually achieves the desired effect in the latent space, refining the attack until the "poisoning knowledge" is optimized.
In essence, this is a blueprint for **gradient-based data poisoning**, where the attacker uses the model's own internal logic (via the surrogate) to craft the most damaging structural changes to the input data.