\n
## Diagram: Knowledge Graph Poisoning Process
### Overview
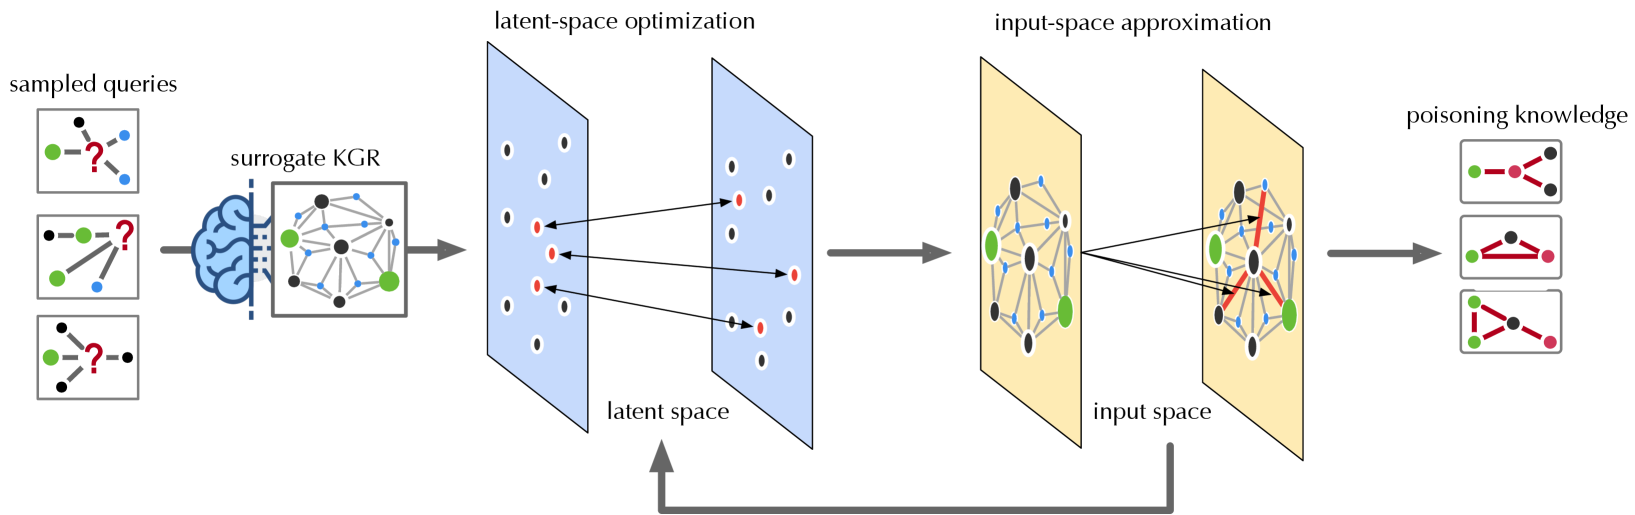
This diagram illustrates a process for poisoning knowledge graphs, starting with sampled queries and culminating in the injection of "poisoning knowledge." The process involves a surrogate knowledge graph (KGR), latent-space optimization, and input-space approximation. The diagram depicts a flow of information and transformations between these stages.
### Components/Axes
The diagram is segmented into four main sections, arranged horizontally from left to right:
1. **Sampled Queries:** Represents initial queries, depicted as brain-like structures with question marks and connected nodes.
2. **Surrogate KGR:** A complex network of nodes and edges, representing a surrogate knowledge graph.
3. **Latent-Space Optimization:** A blue-tinted rectangular area containing nodes and edges, representing the latent space.
4. **Input-Space Approximation:** A yellow-tinted rectangular area containing nodes and edges, representing the input space.
5. **Poisoning Knowledge:** Represents the final output, depicted as connected nodes with arrows.
There are also labels indicating the process stages: "sampled queries", "surrogate KGR", "latent-space optimization", "input-space approximation", and "poisoning knowledge". An upward-pointing double arrow connects the "input space approximation" to the "latent space optimization", indicating a feedback loop.
### Detailed Analysis or Content Details
**1. Sampled Queries (Leftmost Section):**
* There are three query examples. Each consists of a brain-like shape with a question mark at the center, connected to several smaller nodes (approximately 5-7 per query).
* The connections between the brain and nodes are represented by lines.
* The nodes are colored green and black.
**2. Surrogate KGR (Center-Left Section):**
* This is a complex network of approximately 15-20 nodes connected by numerous edges.
* The nodes are colored green, black, and white.
* Edges are represented by lines, some dashed.
* The network appears to be a graph structure.
**3. Latent-Space Optimization (Center Section):**
* This section contains approximately 15-20 nodes arranged in a grid-like pattern within a blue rectangle.
* Nodes are colored green, black, and red.
* Edges connect the nodes, represented by lines.
* The connections appear to be sparse.
**4. Input-Space Approximation (Center-Right Section):**
* This section contains approximately 15-20 nodes arranged in a network within a yellow rectangle.
* Nodes are colored green, black, and red.
* Edges connect the nodes, represented by lines.
* The connections appear to be more dense than in the latent space.
**5. Poisoning Knowledge (Rightmost Section):**
* There are three examples of "poisoning knowledge". Each consists of a set of connected nodes (approximately 3-5 per example).
* Nodes are colored green and red.
* Edges are represented by arrows.
* The arrows indicate the direction of influence or flow.
**Flow of Information:**
* The "sampled queries" feed into the "surrogate KGR".
* The "surrogate KGR" transforms the queries and passes them to the "latent-space optimization".
* The "latent-space optimization" then passes the information to the "input-space approximation".
* The "input-space approximation" generates the "poisoning knowledge".
* There is a feedback loop from the "input-space approximation" back to the "latent-space optimization".
### Key Observations
* The diagram illustrates a multi-stage process for manipulating knowledge graphs.
* The color red consistently appears in the "latent-space optimization", "input-space approximation", and "poisoning knowledge" sections, potentially indicating the injected "poison".
* The density of connections increases from the latent space to the input space.
* The feedback loop suggests an iterative refinement process.
### Interpretation
The diagram depicts a method for injecting malicious information ("poisoning knowledge") into a knowledge graph. The process begins with sampling queries, which are then processed through a surrogate knowledge graph to create a latent representation. This latent representation is optimized and then approximated in the input space, ultimately resulting in the generation of poisoned knowledge. The feedback loop suggests that the process is iterative, allowing for refinement of the poisoned knowledge to maximize its impact. The use of a surrogate KGR and latent space optimization likely aims to obfuscate the poisoning attack, making it more difficult to detect. The red color coding suggests that the injected "poison" is represented by these nodes and edges. This diagram is a conceptual illustration of a potential attack vector, rather than a presentation of specific data. It demonstrates a process, not a quantifiable result.