## Flowchart: Knowledge Graph Reasoning and Poisoning Process
### Overview
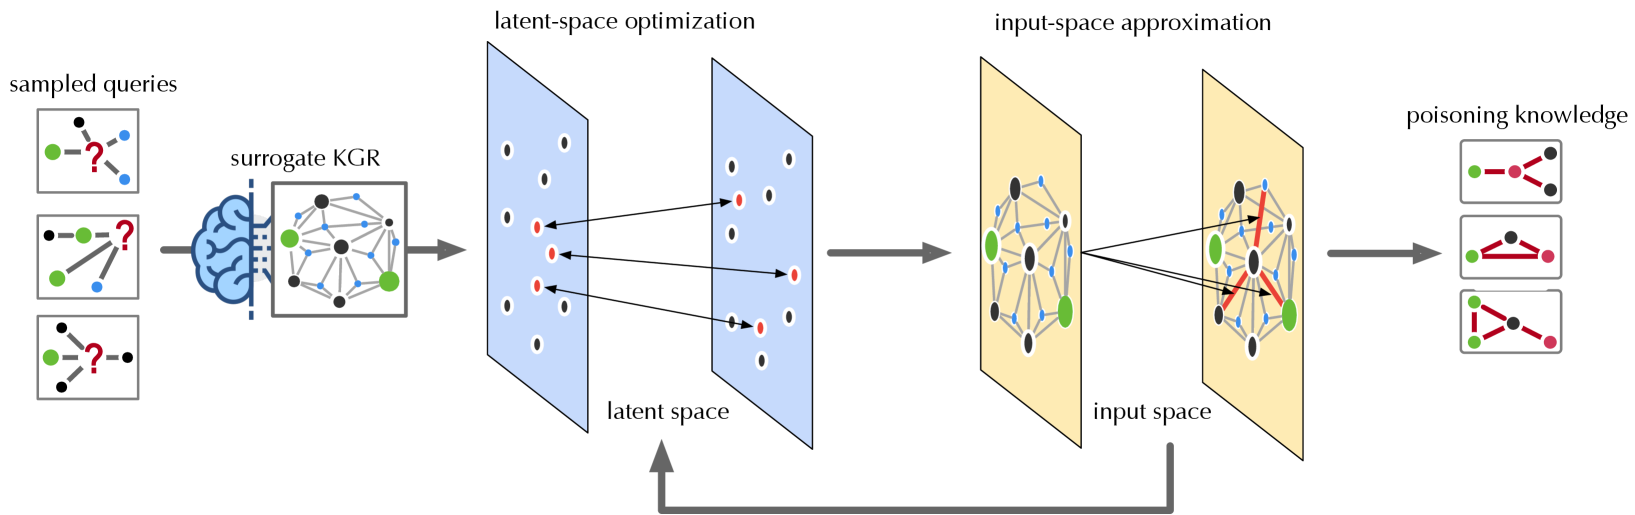
The image depicts a multi-stage technical process involving knowledge graph reasoning (KGR), latent-space optimization, input-space approximation, and poisoning knowledge. The workflow begins with sampled queries, progresses through surrogate KGR and latent-space optimization, transitions to input-space approximation, and concludes with poisoning knowledge. Arrows indicate directional flow, and color-coded nodes/edges represent different components or statuses.
---
### Components/Axes
1. **Sampled Queries**
- Three diagrams with nodes (green, black) and edges (blue).
- One node in each diagram is marked with a red question mark (indicating uncertainty or target for poisoning).
2. **Surrogate KGR**
- A graph with interconnected nodes (green, black) and edges (blue).
- Positioned between "sampled queries" and "latent-space optimization."
3. **Latent-Space Optimization**
- Two panels:
- **Left Panel**: Nodes (black) with red points (targets) connected by arrows.
- **Right Panel**: Nodes (black) with red points (targets) and additional red edges.
- Arrows connect the surrogate KGR to both panels, indicating mapping to latent space.
4. **Input-Space Approximation**
- A graph with nodes (green, black) and edges (blue, red).
- Arrows connect the latent-space optimization panels to this stage, showing reconstruction in input space.
5. **Poisoning Knowledge**
- Three diagrams with nodes (green, black) and edges (red).
- Red edges dominate, suggesting adversarial modifications.
---
### Detailed Analysis
- **Color Coding**:
- **Green**: Likely represents correct/valid nodes.
- **Black**: Neutral or unspecified nodes.
- **Red**: Targets for poisoning or adversarial modifications.
- **Flow Direction**:
- Queries → Surrogate KGR → Latent-space optimization → Input-space approximation → Poisoning knowledge.
- **Key Relationships**:
- The surrogate KGR acts as a bridge between raw queries and latent-space optimization.
- Latent-space optimization refines targets (red points) before input-space approximation.
- Poisoning knowledge introduces adversarial edges (red) into the final graph.
---
### Key Observations
1. **Adversarial Focus**: The red question marks and edges highlight the process's focus on manipulating specific nodes/edges.
2. **Bidirectional Mapping**: The latent-space optimization includes feedback loops (arrows pointing back to input-space approximation), suggesting iterative refinement.
3. **Poisoning Mechanism**: The final stage replaces blue edges with red ones, indicating a shift from valid to adversarial relationships.
---
### Interpretation
This flowchart illustrates a machine learning pipeline for knowledge graph reasoning with adversarial attacks. The process begins by sampling queries, then uses a surrogate KGR to map them into a latent space for optimization. The optimized targets are reconstructed in the input space, and finally, adversarial modifications (poisoning) are introduced to corrupt the knowledge graph. The use of red nodes/edges in the poisoning stage suggests a deliberate attempt to degrade model performance by altering critical relationships. The bidirectional arrows between latent and input spaces imply a feedback mechanism to improve approximation accuracy.