## Bar Chart: Normalized Runtime Comparison
### Overview
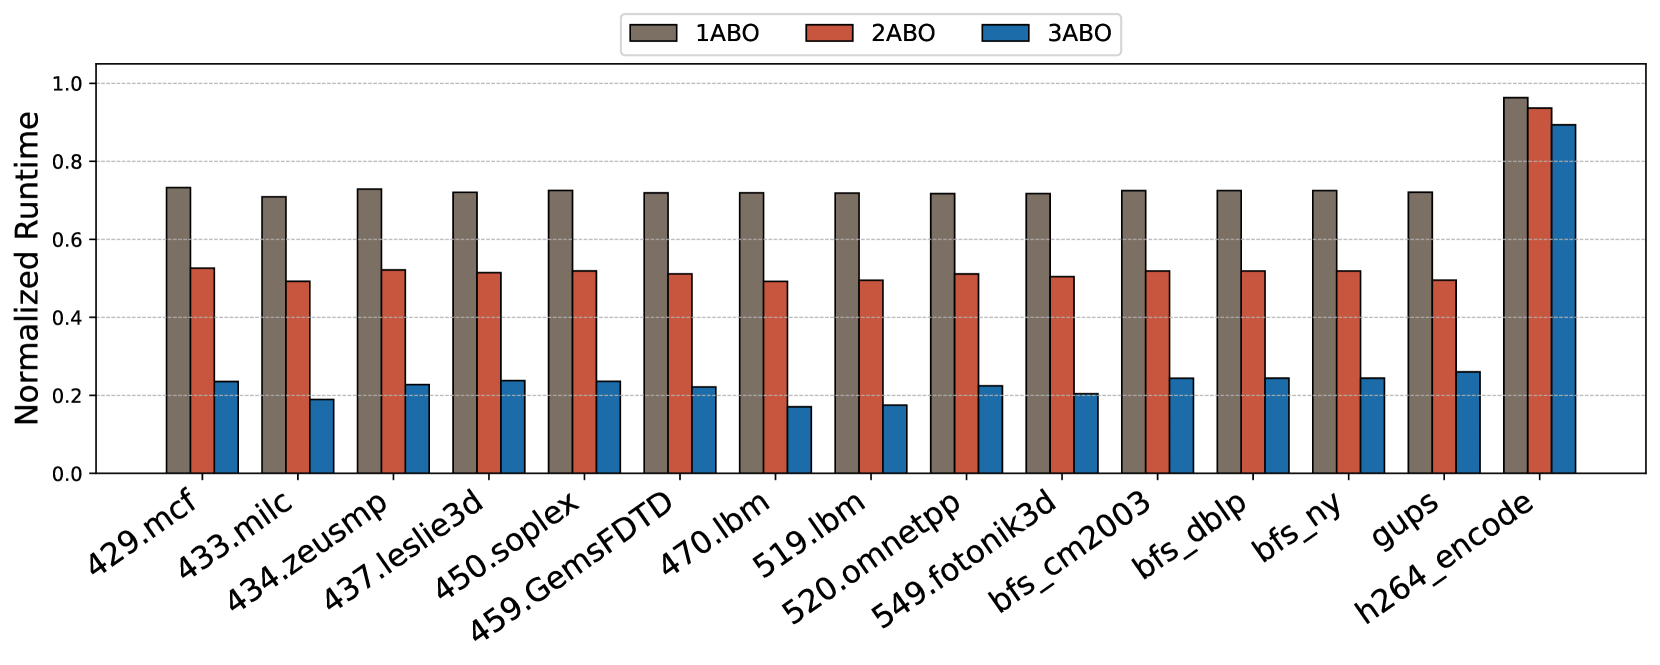
The image is a bar chart comparing the normalized runtime of different benchmarks under three configurations: 1ABO, 2ABO, and 3ABO. The x-axis represents the benchmark names, and the y-axis represents the normalized runtime, ranging from 0.0 to 1.0. The chart displays the performance of each benchmark for each configuration using vertical bars.
### Components/Axes
* **Title:** None explicitly present in the image.
* **X-axis:** Benchmark names (429.mcf, 433.milc, 434.zeusmp, 437.leslie3d, 450.soplex, 459.GemsFDTD, 470.lbm, 519.lbm, 520.omnetpp, 549.fotonik3d, bfs\_cm2003, bfs\_dblp, bfs\_ny, gups, h264\_encode).
* **Y-axis:** Normalized Runtime, ranging from 0.0 to 1.0 in increments of 0.2.
* **Legend:** Located at the top of the chart.
* 1ABO: Dark gray bar
* 2ABO: Red-orange bar
* 3ABO: Blue bar
### Detailed Analysis
The chart compares the normalized runtime of 15 different benchmarks under three configurations: 1ABO, 2ABO, and 3ABO.
* **429.mcf:**
* 1ABO: ~0.74
* 2ABO: ~0.53
* 3ABO: ~0.24
* **433.milc:**
* 1ABO: ~0.72
* 2ABO: ~0.50
* 3ABO: ~0.19
* **434.zeusmp:**
* 1ABO: ~0.72
* 2ABO: ~0.53
* 3ABO: ~0.24
* **437.leslie3d:**
* 1ABO: ~0.72
* 2ABO: ~0.52
* 3ABO: ~0.24
* **450.soplex:**
* 1ABO: ~0.72
* 2ABO: ~0.52
* 3ABO: ~0.24
* **459.GemsFDTD:**
* 1ABO: ~0.72
* 2ABO: ~0.51
* 3ABO: ~0.22
* **470.lbm:**
* 1ABO: ~0.72
* 2ABO: ~0.51
* 3ABO: ~0.17
* **519.lbm:**
* 1ABO: ~0.72
* 2ABO: ~0.52
* 3ABO: ~0.21
* **520.omnetpp:**
* 1ABO: ~0.72
* 2ABO: ~0.52
* 3ABO: ~0.21
* **549.fotonik3d:**
* 1ABO: ~0.73
* 2ABO: ~0.52
* 3ABO: ~0.20
* **bfs\_cm2003:**
* 1ABO: ~0.73
* 2ABO: ~0.52
* 3ABO: ~0.24
* **bfs\_dblp:**
* 1ABO: ~0.73
* 2ABO: ~0.52
* 3ABO: ~0.24
* **bfs\_ny:**
* 1ABO: ~0.70
* 2ABO: ~0.48
* 3ABO: ~0.26
* **gups:**
* 1ABO: ~0.97
* 2ABO: ~0.96
* 3ABO: ~0.90
* **h264\_encode:**
* 1ABO: ~0.97
* 2ABO: ~0.94
* 3ABO: ~0.90
### Key Observations
* For most benchmarks, 1ABO has the highest normalized runtime, followed by 2ABO, and then 3ABO.
* The 'gups' and 'h264\_encode' benchmarks show significantly higher normalized runtimes compared to the others, across all three configurations.
* The difference in normalized runtime between 1ABO and 2ABO is relatively small compared to the difference between 2ABO and 3ABO.
* The normalized runtime for 3ABO is consistently lower than 1ABO and 2ABO across all benchmarks.
### Interpretation
The data suggests that the 3ABO configuration generally results in lower normalized runtime compared to 1ABO and 2ABO, indicating potentially better performance. The 'gups' and 'h264\_encode' benchmarks are outliers, showing significantly higher normalized runtimes, which could be due to their specific characteristics or optimization strategies. The consistent trend across most benchmarks suggests that the number of ABO configurations has a noticeable impact on runtime performance. The lower normalized runtime for 3ABO could be due to increased parallelism or other optimizations that reduce the overall execution time.