## Line/Scatter Chart: Fault Rate vs. PPL Across Checkpoints and Phases
### Overview
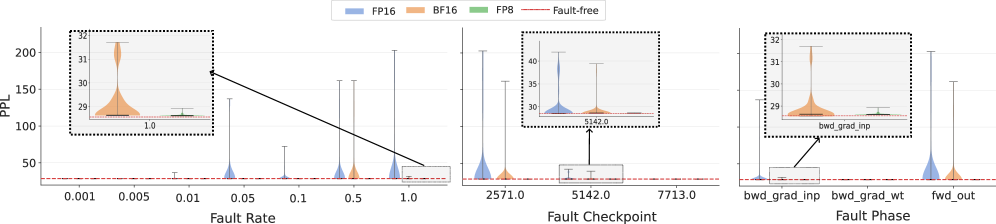
The image presents three side-by-side panels analyzing the relationship between fault rates/checkpoints/phases and PPL (likely "Pass/Fail/Likelihood" or a similar metric). Each panel includes a main plot and an inset highlighting specific distributions. The legend at the top identifies four data series: FP16 (blue), BF16 (orange), FP8 (green), and Fault-free (red dashed line).
---
### Components/Axes
1. **Panel 1: Fault Rate**
- **X-axis**: Fault Rate (logarithmic scale, 0.001 to 1.0)
- **Y-axis**: PPL (0 to 200)
- **Legend**: FP16 (blue), BF16 (orange), FP8 (green), Fault-free (red dashed)
2. **Panel 2: Fault Checkpoint**
- **X-axis**: Fault Checkpoint (linear scale, 2571.0 to 7713.0)
- **Y-axis**: PPL (0 to 40)
- **Legend**: FP16 (blue), BF16 (orange), FP8 (green), Fault-free (red dashed)
3. **Panel 3: Fault Phase**
- **X-axis**: Fault Phase (categorical: `bwd_grad_inp`, `bwd_grad_wt`, `fwd_out`)
- **Y-axis**: PPL (0 to 35)
- **Legend**: FP16 (blue), BF16 (orange), FP8 (green), Fault-free (red dashed)
---
### Detailed Analysis
#### Panel 1: Fault Rate
- **FP16 (blue)**: Distribution peaks at ~0.05 Fault Rate with PPL ~50. Long tails extend to 0.1 (PPL ~150) and 0.01 (PPL ~20).
- **BF16 (orange)**: Bimodal distribution: sharp peak at ~0.01 (PPL ~30) and a smaller peak at ~0.1 (PPL ~100).
- **FP8 (green)**: Single peak at ~0.1 Fault Rate (PPL ~30).
- **Fault-free (red dashed)**: Flat line at PPL ~30 across all Fault Rates.
- **Inset**: Zoomed view of FP16 and BF16 distributions. FP16 spans 29–32 PPL at 0.01 Fault Rate; BF16 peaks at 31 PPL at 0.01.
#### Panel 2: Fault Checkpoint
- **FP16 (blue)**: Single peak at 5142.0 Checkpoint (PPL ~35).
- **BF16 (orange)**: Sharp peak at 5142.0 (PPL ~40), with a secondary peak at 7713.0 (PPL ~30).
- **FP8 (green)**: Minimal presence; flat line near 30 PPL.
- **Fault-free (red dashed)**: Flat line at ~30 PPL.
- **Inset**: Highlights FP16 and BF16 peaks at 5142.0 (PPL 30–40) and 7713.0 (PPL ~30).
#### Panel 3: Fault Phase
- **FP16 (blue)**: Peak at `bwd_grad_wt` (PPL ~35).
- **BF16 (orange)**: Peak at `bwd_grad_inp` (PPL ~32).
- **FP8 (green)**: Minimal presence; flat line near 30 PPL.
- **Fault-free (red dashed)**: Flat line at ~30 PPL.
- **Inset**: Zoomed view of `bwd_grad_inp` (29–32 PPL) and `bwd_grad_wt` (30–35 PPL).
---
### Key Observations
1. **Fault Rate Sensitivity**:
- BF16 shows the highest sensitivity to low Fault Rates (0.01), with PPL spiking to ~31.
- FP16 and FP8 exhibit higher PPL at moderate Fault Rates (0.05–0.1).
2. **Checkpoint Impact**:
- Checkpoint 5142.0 is a critical failure point for BF16 (PPL ~40) and FP16 (PPL ~35).
- Checkpoint 7713.0 shows reduced PPL for BF16 (~30) but not FP16.
3. **Phase Vulnerabilities**:
- `bwd_grad_wt` (FP16) and `bwd_grad_inp` (BF16) are the most failure-prone phases.
- `fwd_out` has minimal impact across all configurations.
4. **Fault-free Baseline**:
- All configurations maintain a baseline PPL of ~30 when no faults are present.
---
### Interpretation
The data suggests that **BF16** is most vulnerable to low Fault Rates (0.01) and specific checkpoints (5142.0), while **FP16** struggles with moderate Fault Rates (0.05–0.1) and phases like `bwd_grad_wt`. The **Fault-free** baseline indicates a consistent performance floor (~30 PPL), implying that faults amplify errors disproportionately. The insets emphasize localized failure modes, such as FP16's bimodal distribution at 0.01 Fault Rate and BF16's sharp peak at Checkpoint 5142.0. These patterns highlight configuration-specific weaknesses, guiding targeted optimizations for fault resilience.