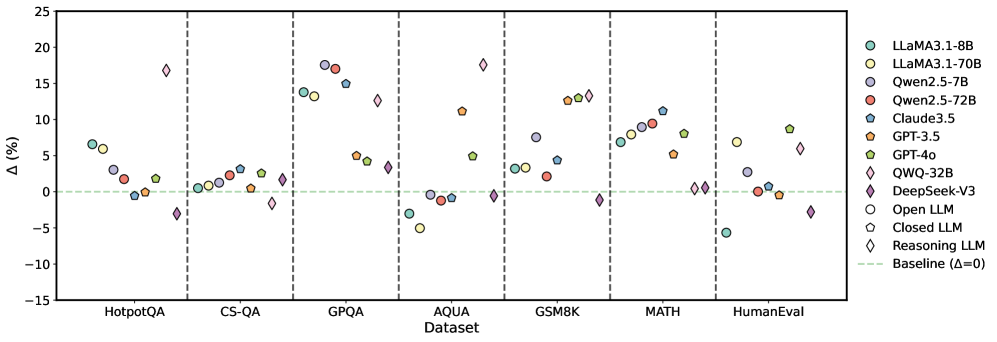
## Scatter Plot: LLM Performance Delta Across Datasets
### Overview
The image is a scatter plot comparing the performance delta (Δ, in percentage) of various Large Language Models (LLMs) across seven different benchmark datasets. The plot uses distinct symbols and colors to represent different models and model types (Open, Closed, Reasoning). A horizontal dashed green line at Δ=0 represents the baseline performance.
### Components/Axes
* **Y-Axis:** Label is "Δ (%)". Scale ranges from -15 to 25, with major ticks at intervals of 5.
* **X-Axis:** Label is "Dataset". Seven categorical datasets are listed, separated by vertical dashed lines:
1. HotpotQA
2. CS-QA
3. GPQA
4. AQUA
5. GSM8K
6. MATH
7. HumanEval
* **Legend (Position: Top-Right):** Contains 11 entries, defining model names and their corresponding symbols/colors, plus a baseline indicator.
* **Models & Symbols:**
* LLaMA3.1-8B: Light green circle
* LLaMA3.1-70B: Yellow circle
* Qwen2.5-7B: Light blue circle
* Qwen2.5-72B: Red circle
* Claude3.5: Blue star
* GPT-3.5: Orange pentagon
* GPT-4o: Yellow pentagon
* QWQ-32B: Pink diamond
* DeepSeek-V3: Purple diamond
* **Model Type Indicators:**
* Open LLM: Circle symbol
* Closed LLM: Pentagon symbol
* Reasoning LLM: Diamond symbol
* **Baseline:** Green dashed line labeled "Baseline (Δ=0)"
### Detailed Analysis
Performance deltas are plotted for each model within each dataset column. Values are approximate based on visual positioning.
**1. HotpotQA:**
* LLaMA3.1-8B: ~+7%
* LLaMA3.1-70B: ~+6%
* Qwen2.5-7B: ~+3%
* Qwen2.5-72B: ~+1%
* Claude3.5: ~0%
* GPT-3.5: ~+2%
* QWQ-32B: ~+17% (Significant outlier, highest in this group)
* DeepSeek-V3: ~-3%
**2. CS-QA:**
* LLaMA3.1-8B: ~0%
* LLaMA3.1-70B: ~+1%
* Qwen2.5-7B: ~+2%
* Qwen2.5-72B: ~+3%
* Claude3.5: ~+1%
* GPT-3.5: ~+3%
* QWQ-32B: ~-2%
* DeepSeek-V3: ~+2%
* *Trend:* Most models cluster near the baseline (0-3% range).
**3. GPQA:**
* LLaMA3.1-8B: ~+14%
* LLaMA3.1-70B: ~+13%
* Qwen2.5-7B: ~+18% (Highest in this group)
* Qwen2.5-72B: ~+17%
* Claude3.5: ~+15%
* GPT-3.5: ~+5%
* GPT-4o: ~+4%
* QWQ-32B: ~+13%
* DeepSeek-V3: ~+3%
* *Trend:* Most models show a strong positive delta, with several above +13%.
**4. AQUA:**
* LLaMA3.1-8B: ~-3%
* LLaMA3.1-70B: ~-5%
* Qwen2.5-7B: ~0%
* Qwen2.5-72B: ~-1%
* Claude3.5: ~0%
* GPT-3.5: ~+11%
* GPT-4o: ~+5%
* QWQ-32B: ~+18% (Highest in this group)
* DeepSeek-V3: ~0%
* *Trend:* Mixed performance. Open-source models (circles) are at or below baseline, while some closed/reasoning models show high positive deltas.
**5. GSM8K:**
* LLaMA3.1-8B: ~+3%
* LLaMA3.1-70B: ~+2%
* Qwen2.5-7B: ~+8%
* Qwen2.5-72B: ~+2%
* Claude3.5: ~+4%
* GPT-3.5: ~+13%
* GPT-4o: ~+13%
* QWQ-32B: ~+13%
* DeepSeek-V3: ~-1%
* *Trend:* Generally positive deltas, with GPT-3.5, GPT-4o, and QWQ-32B clustered at the high end (~+13%).
**6. MATH:**
* LLaMA3.1-8B: ~+7%
* LLaMA3.1-70B: ~+8%
* Qwen2.5-7B: ~+9%
* Qwen2.5-72B: ~+11%
* Claude3.5: ~+8%
* GPT-3.5: ~+5%
* GPT-4o: ~0%
* QWQ-32B: ~0%
* DeepSeek-V3: ~0%
* *Trend:* Open-source models (circles) show a clear upward trend in performance delta, while closed/reasoning models (pentagons, diamonds) are at or near baseline.
**7. HumanEval:**
* LLaMA3.1-8B: ~-5%
* LLaMA3.1-70B: ~+7%
* Qwen2.5-7B: ~+3%
* Qwen2.5-72B: ~0%
* Claude3.5: ~0%
* GPT-3.5: ~-1%
* GPT-4o: ~+9%
* QWQ-32B: ~+6%
* DeepSeek-V3: ~-3%
* *Trend:* Highly variable performance with no clear grouping by model type.
### Key Observations
1. **Dataset Sensitivity:** Model performance delta is highly dependent on the dataset. No single model dominates across all benchmarks.
2. **GPQA & AQUA Outliers:** The QWQ-32B (Reasoning LLM) shows exceptionally high positive deltas on GPQA (~+13%) and AQUA (~+18%), making it a standout on these specific tasks.
3. **MATH Trend:** A clear pattern emerges on the MATH dataset where open-source models (circles) consistently show positive performance deltas, while closed and reasoning models cluster near zero.
4. **Baseline Clustering:** On CS-QA, most models, regardless of type, cluster within a narrow band near the baseline (Δ=0 to +3%).
5. **Symbol Consistency:** The legend's model type indicators (Open/Closed/Reasoning) are consistently applied to the symbols in the plot, allowing for categorical analysis.
### Interpretation
This chart visualizes the **relative performance change (Δ)** of various LLMs compared to an unspecified baseline across diverse reasoning and knowledge benchmarks. The data suggests:
* **Specialization Over Generalization:** The significant variance in Δ across datasets indicates that LLM capabilities are not uniform. Models excel in specific domains (e.g., QWQ-32B on AQUA/GPQA, open-source models on MATH) rather than demonstrating blanket superiority.
* **Model Type Insights:** The grouping by symbol type reveals potential trends. For instance, on the MATH dataset, open-source models (circles) appear to have a performance advantage over closed models (pentagons) in this specific comparison. Conversely, on AQUA, reasoning models (diamonds) show the highest deltas.
* **Benchmark Diversity:** The choice of benchmark critically affects the perceived performance of a model. A model like Qwen2.5-72B shows a high positive delta on GPQA (~+17%) but a negative delta on HumanEval (~0% or slightly below), highlighting the importance of multi-faceted evaluation.
* **Investigative Lead:** The most notable anomaly is the performance of QWQ-32B on AQUA and GPQA. This warrants further investigation into the model's architecture or training data that might give it a specific advantage on these particular types of questions (likely scientific or complex reasoning QA). The chart effectively argues against using a single benchmark to rank LLMs.