## Chart: Brain Alignment vs. Initialization Standard Deviation
### Overview
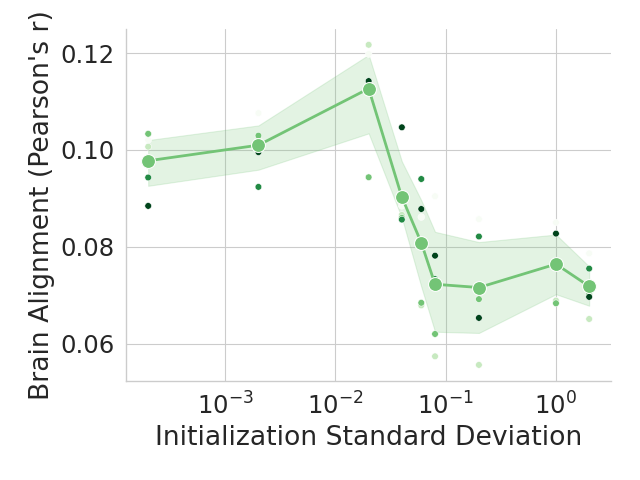
The image is a scatter plot with a line graph overlayed, showing the relationship between "Brain Alignment (Pearson's r)" and "Initialization Standard Deviation". The x-axis is on a logarithmic scale. The plot displays a trend of brain alignment increasing with initialization standard deviation up to a point, then decreasing. A shaded region around the line indicates variability or confidence intervals.
### Components/Axes
* **X-axis:** Initialization Standard Deviation (logarithmic scale). Axis markers are 10<sup>-3</sup>, 10<sup>-2</sup>, 10<sup>-1</sup>, and 10<sup>0</sup>.
* **Y-axis:** Brain Alignment (Pearson's r). Axis markers are 0.06, 0.08, 0.10, and 0.12.
* **Data Series:** A green line with circular markers represents the average brain alignment for each initialization standard deviation. A shaded green area around the line represents the confidence interval or standard deviation. Individual data points are scattered around the line, with varying shades of green.
### Detailed Analysis
* **Trend:** The green line initially slopes upward from approximately (10<sup>-3</sup>, 0.098) to (10<sup>-2</sup>, 0.111). It then sharply decreases to approximately (0.1, 0.072), and then slightly increases to approximately (1, 0.075).
* **Data Points:**
* At 10<sup>-3</sup>, the green line is at approximately 0.098. The shaded region spans from approximately 0.09 to 0.102.
* At 10<sup>-2</sup>, the green line is at approximately 0.111. The shaded region spans from approximately 0.098 to 0.12.
* At 10<sup>-1</sup>, the green line is at approximately 0.072. The shaded region spans from approximately 0.06 to 0.08.
* At 10<sup>0</sup>, the green line is at approximately 0.075. The shaded region spans from approximately 0.068 to 0.08.
* **Scatter:** The individual data points are scattered around the green line, indicating the distribution of brain alignment values for each initialization standard deviation. The density of points appears to be higher around the peak of the green line.
### Key Observations
* Brain alignment peaks at an initialization standard deviation of approximately 10<sup>-2</sup>.
* There is a sharp decline in brain alignment as the initialization standard deviation increases from 10<sup>-2</sup> to 10<sup>-1</sup>.
* The shaded region indicates that the variability in brain alignment is higher around the peak and lower at the extremes of the initialization standard deviation.
### Interpretation
The data suggests that there is an optimal initialization standard deviation for maximizing brain alignment, which is around 10<sup>-2</sup>. Too low or too high initialization standard deviations result in lower brain alignment. The variability in brain alignment, as indicated by the shaded region, suggests that the relationship between initialization standard deviation and brain alignment is not deterministic and may be influenced by other factors. The sharp decline after the peak suggests that there may be a critical threshold beyond which increasing the initialization standard deviation negatively impacts brain alignment.