\n
## Line Chart: Brain Alignment vs. Initialization Standard Deviation
### Overview
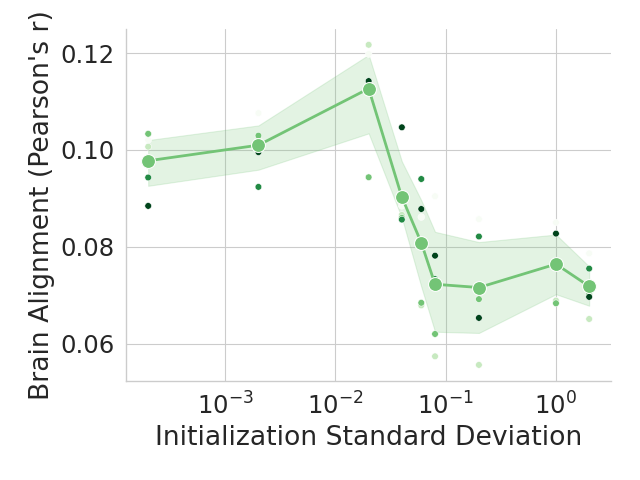
The image presents a line chart illustrating the relationship between "Initialization Standard Deviation" and "Brain Alignment (Pearson's r)". The chart displays a central line representing the trend, surrounded by a shaded region indicating variability or confidence intervals. Individual data points are scattered around the line. The x-axis uses a logarithmic scale.
### Components/Axes
* **X-axis:** "Initialization Standard Deviation" with a logarithmic scale ranging from 10<sup>-3</sup> to 10<sup>0</sup> (1). Markers are at 10<sup>-3</sup>, 10<sup>-2</sup>, 10<sup>-1</sup>, and 10<sup>0</sup>.
* **Y-axis:** "Brain Alignment (Pearson's r)" ranging from approximately 0.06 to 0.12.
* **Line:** A single green line representing the central tendency of the data.
* **Shaded Region:** A light green shaded area surrounding the line, representing the variability or confidence interval.
* **Data Points:** Numerous dark green dots scattered around the line, representing individual data observations.
### Detailed Analysis
The line chart shows a complex relationship.
* **Initial Trend (10<sup>-3</sup> to 10<sup>-2</sup>):** The line initially shows a slight increase in Brain Alignment as Initialization Standard Deviation increases from 10<sup>-3</sup> to 10<sup>-2</sup>.
* At 10<sup>-3</sup>, Brain Alignment is approximately 0.095.
* At 10<sup>-2</sup>, Brain Alignment reaches a local maximum of approximately 0.11.
* **Peak and Decline (10<sup>-2</sup> to 10<sup>-1</sup>):** From 10<sup>-2</sup> to 10<sup>-1</sup>, the line exhibits a sharp decline in Brain Alignment.
* At 10<sup>-1</sup>, Brain Alignment drops to approximately 0.075.
* **Stabilization (10<sup>-1</sup> to 10<sup>0</sup>):** Between 10<sup>-1</sup> and 10<sup>0</sup>, the line stabilizes, showing a slight fluctuation around 0.08.
* At 10<sup>0</sup>, Brain Alignment is approximately 0.078.
The data points are generally clustered around the line, but there is noticeable scatter, particularly at the higher Initialization Standard Deviation values (around 10<sup>-1</sup> and 10<sup>0</sup>).
### Key Observations
* The relationship between Initialization Standard Deviation and Brain Alignment is not monotonic. It initially increases, then decreases, and finally stabilizes.
* The most significant change in Brain Alignment occurs between Initialization Standard Deviation values of 10<sup>-2</sup> and 10<sup>-1</sup>.
* The shaded region indicates a relatively wide range of variability, especially at higher Initialization Standard Deviation values.
* There are no obvious outliers, but the scatter of data points suggests that other factors may influence Brain Alignment.
### Interpretation
The chart suggests that there is an optimal range for the Initialization Standard Deviation to maximize Brain Alignment. Increasing the Initialization Standard Deviation beyond a certain point (around 10<sup>-2</sup>) leads to a decrease in Brain Alignment. The stabilization at higher values suggests that further increases in Initialization Standard Deviation do not significantly impact Brain Alignment, but also do not improve it.
The variability indicated by the shaded region suggests that the relationship is not deterministic and that other variables likely play a role in determining Brain Alignment. The logarithmic scale on the x-axis implies that small changes in Initialization Standard Deviation at lower values have a greater impact than similar changes at higher values.
This data could be used to inform the selection of an appropriate Initialization Standard Deviation value for a system or model where Brain Alignment is a desired outcome. The optimal value appears to be around 10<sup>-2</sup>, but further investigation may be needed to account for the observed variability.