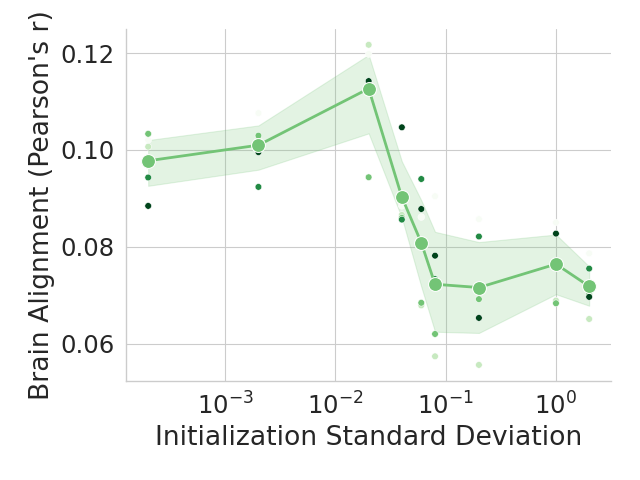
## Line Graph: Brain Alignment vs. Initialization Standard Deviation
### Overview
The image depicts a line graph illustrating the relationship between **Brain Alignment (Pearson's r)** and **Initialization Standard Deviation**. The graph includes a green line representing the trend, shaded green areas indicating variability, and scattered green data points. The x-axis (logarithmic scale) ranges from 10⁻³ to 10⁰, while the y-axis (linear scale) spans 0.06 to 0.12.
---
### Components/Axes
- **X-axis (Initialization Standard Deviation)**: Logarithmic scale with markers at 10⁻³, 10⁻², 10⁻¹, and 10⁰.
- **Y-axis (Brain Alignment)**: Linear scale with markers at 0.06, 0.08, 0.10, and 0.12.
- **Legend**: Located in the top-right corner, labeled "Brain Alignment (Pearson's r)" with a green line and shaded area.
- **Data Points**: Green circles with error bars (not explicitly labeled but implied by shaded regions).
---
### Detailed Analysis
1. **Trend Line**:
- **10⁻³**: Brain Alignment ≈ 0.10 (data points cluster around this value).
- **10⁻²**: Peak at ≈ 0.11 (highest alignment, shaded area widest here).
- **10⁻¹**: Sharp decline to ≈ 0.08 (data points spread between 0.07–0.09).
- **10⁰**: Further drop to ≈ 0.07 (data points range from 0.065–0.075).
2. **Shaded Area (Variability)**:
- Narrowest at 10⁻³ and 10⁰, widest at 10⁻², suggesting higher uncertainty in alignment at the peak.
3. **Data Points**:
- All points align with the trend line, though some scatter exists (e.g., at 10⁻¹, points range from 0.065–0.09).
---
### Key Observations
- **Peak Alignment**: Maximum Brain Alignment (≈0.11) occurs at an Initialization Standard Deviation of 10⁻².
- **Decline at Higher Deviations**: Alignment drops sharply as deviation increases beyond 10⁻².
- **Variability Pattern**: Uncertainty (shaded area) is highest at the peak (10⁻²) and lowest at the extremes (10⁻³ and 10⁰).
---
### Interpretation
The data suggests an **optimal initialization standard deviation** of ~10⁻² for maximizing Brain Alignment. However, the sharp decline at higher deviations implies that excessively large initializations may degrade performance. The increased variability at the peak (10⁻²) could indicate sensitivity to initialization parameters in this range. This trend might reflect a trade-off between alignment and stability, where moderate deviations yield the best balance. Further investigation into initialization strategies could leverage this relationship to improve model robustness.