# Technical Document Extraction: GCG Loss and Transfer ASR Analysis
## Chart Overview
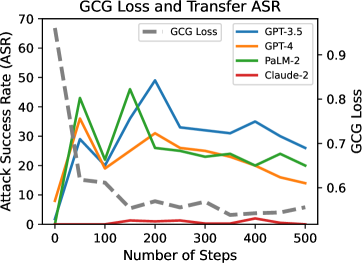
This image is a **line chart** titled **"GCG Loss and Transfer ASR"**, comparing performance metrics across different models over a series of steps. The chart includes two y-axes and four data series, with a legend for color coding.
---
### **Axis Labels and Scales**
- **X-Axis**:
- Title: **"Number of Steps"**
- Range: **0 to 500** (increments of 100).
- **Left Y-Axis**:
- Title: **"Attack Success Rate (ASR)"**
- Scale: **0 to 70** (increments of 10).
- **Right Y-Axis**:
- Title: **"GCG Loss"**
- Scale: **0.6 to 0.9** (increments of 0.1).
---
### **Legend and Data Series**
The legend is located in the **upper-right corner** of the chart. Colors and labels are as follows:
1. **GPT-3.5**: Blue solid line.
2. **GPT-4**: Orange solid line.
3. **PaLM-2**: Green solid line.
4. **Claude-2**: Red solid line.
5. **GCG Loss**: Gray dashed line.
---
### **Key Trends and Data Points**
#### 1. **GCG Loss (Gray Dashed Line)**
- **Trend**: Starts at **0.9 GCG Loss**, showing a **steady decline** across all steps.
- **Data Points**:
- At 0 steps: **0.9 GCG Loss**.
- At 500 steps: **0.6 GCG Loss**.
#### 2. **GPT-3.5 (Blue Line)**
- **Trend**: Begins at **10 ASR**, peaks at **50 ASR** around 200 steps, then declines to **25 ASR** by 500 steps.
- **Data Points**:
- At 0 steps: **10 ASR**.
- At 200 steps: **50 ASR**.
- At 500 steps: **25 ASR**.
#### 3. **GPT-4 (Orange Line)**
- **Trend**: Starts at **15 ASR**, peaks at **35 ASR** around 100 steps, then declines to **15 ASR** by 500 steps.
- **Data Points**:
- At 0 steps: **15 ASR**.
- At 100 steps: **35 ASR**.
- At 500 steps: **15 ASR**.
#### 4. **PaLM-2 (Green Line)**
- **Trend**: Begins at **5 ASR**, rises sharply to **45 ASR** around 100 steps, fluctuates, and ends at **20 ASR** by 500 steps.
- **Data Points**:
- At 0 steps: **5 ASR**.
- At 100 steps: **45 ASR**.
- At 500 steps: **20 ASR**.
#### 5. **Claude-2 (Red Line)**
- **Trend**: Remains **near 0 ASR** throughout all steps, with minimal fluctuation.
- **Data Points**:
- At 0 steps: **~0 ASR**.
- At 500 steps: **~0 ASR**.
---
### **Spatial Grounding and Color Verification**
- **Legend Position**: Upper-right corner.
- **Color Consistency**:
- Blue = GPT-3.5 (confirmed).
- Orange = GPT-4 (confirmed).
- Green = PaLM-2 (confirmed).
- Red = Claude-2 (confirmed).
- Gray dashed = GCG Loss (confirmed).
---
### **Additional Observations**
- **Dual Y-Axes**: The chart uses separate scales for ASR (left) and GCG Loss (right), allowing comparison of absolute values (ASR) and normalized metrics (GCG Loss).
- **Model Performance**:
- **GPT-3.5** and **GPT-4** show similar trends but differ in peak performance.
- **PaLM-2** exhibits the highest initial ASR but declines over time.
- **Claude-2** maintains negligible ASR, suggesting minimal effectiveness.
- **GCG Loss** decreases monotonically, indicating improved model stability or reduced error over time.
---
### **Conclusion**
The chart illustrates how different models (GPT-3.5, GPT-4, PaLM-2, Claude-2) perform in terms of **Attack Success Rate (ASR)** and **GCG Loss** across 500 steps. GCG Loss consistently declines, while ASR trends vary by model, with PaLM-2 showing the highest initial performance and Claude-2 the lowest.