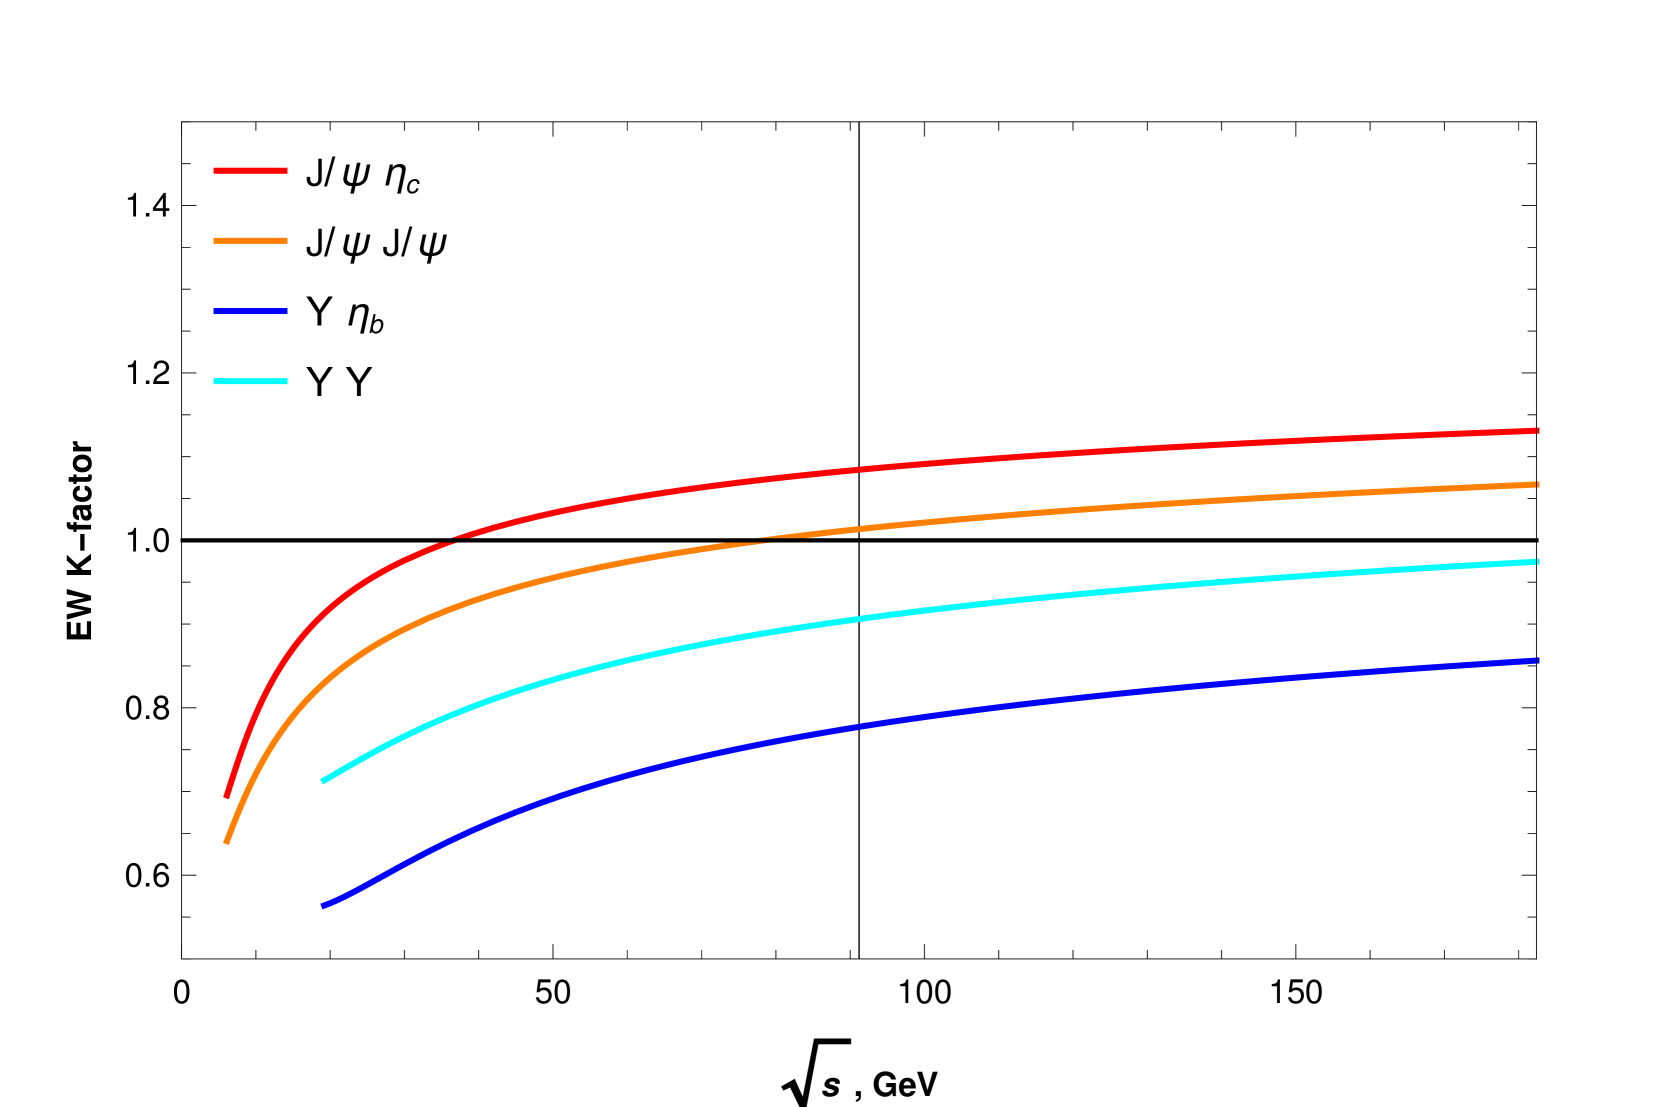
## Line Graph: Electroweak K-factor vs. Center-of-Mass Energy (√s)
### Overview
The graph illustrates the variation of the Electroweak (EW) K-factor as a function of the center-of-mass energy (√s, in GeV) for four distinct particle combinations. Four colored lines represent different particle pairs, with all trends showing an upward trajectory as √s increases. The K-factor quantifies corrections to electroweak interactions, with values exceeding 1.0 indicating enhanced effects.
### Components/Axes
- **X-axis**: √s (GeV), ranging from 0 to 200 GeV in logarithmic increments.
- **Y-axis**: EW K-factor, ranging from 0.6 to 1.4.
- **Legend**: Located in the top-right corner, mapping colors to particle pairs:
- **Red**: J/ψ η_c
- **Orange**: J/ψ J/ψ
- **Blue**: Υ η_b
- **Cyan**: Υ Υ
### Detailed Analysis
1. **Red Line (J/ψ η_c)**:
- Starts at ~0.65 at √s = 0 GeV.
- Rises steeply to ~1.1 at √s = 200 GeV.
- Maintains the highest K-factor across all energies.
2. **Orange Line (J/ψ J/ψ)**:
- Begins at ~0.6 at √s = 0 GeV.
- Increases gradually to ~1.05 at √s = 200 GeV.
- Crosses the red line near √s = 50 GeV, then remains below it.
3. **Blue Line (Υ η_b)**:
- Starts at ~0.55 at √s = 0 GeV.
- Rises slowly to ~0.85 at √s = 200 GeV.
- Remains the lowest K-factor throughout.
4. **Cyan Line (Υ Υ)**:
- Begins at ~0.7 at √s = 0 GeV.
- Increases modestly to ~0.95 at √s = 200 GeV.
- Outperforms the blue line but lags behind orange/red.
### Key Observations
- All K-factors increase with √s, but rates of growth differ significantly.
- J/ψ η_c (red) exhibits the steepest slope, suggesting the largest energy-dependent corrections.
- Υ η_b (blue) shows the weakest dependence on √s.
- No lines intersect after √s = 50 GeV; the hierarchy stabilizes with red > orange > cyan > blue.
### Interpretation
The data suggests that the J/ψ η_c system experiences the most pronounced electroweak corrections, potentially due to its unique quantum numbers or mass hierarchy. The Υ η_b system’s minimal K-factor implies weaker sensitivity to electroweak effects. The divergence between particle pairs highlights the importance of considering specific quantum states when modeling high-energy interactions. These trends could inform precision calculations in collider experiments, where K-factor corrections are critical for accurate cross-section predictions.