## Chart Type: Correlation Heatmap
### Overview
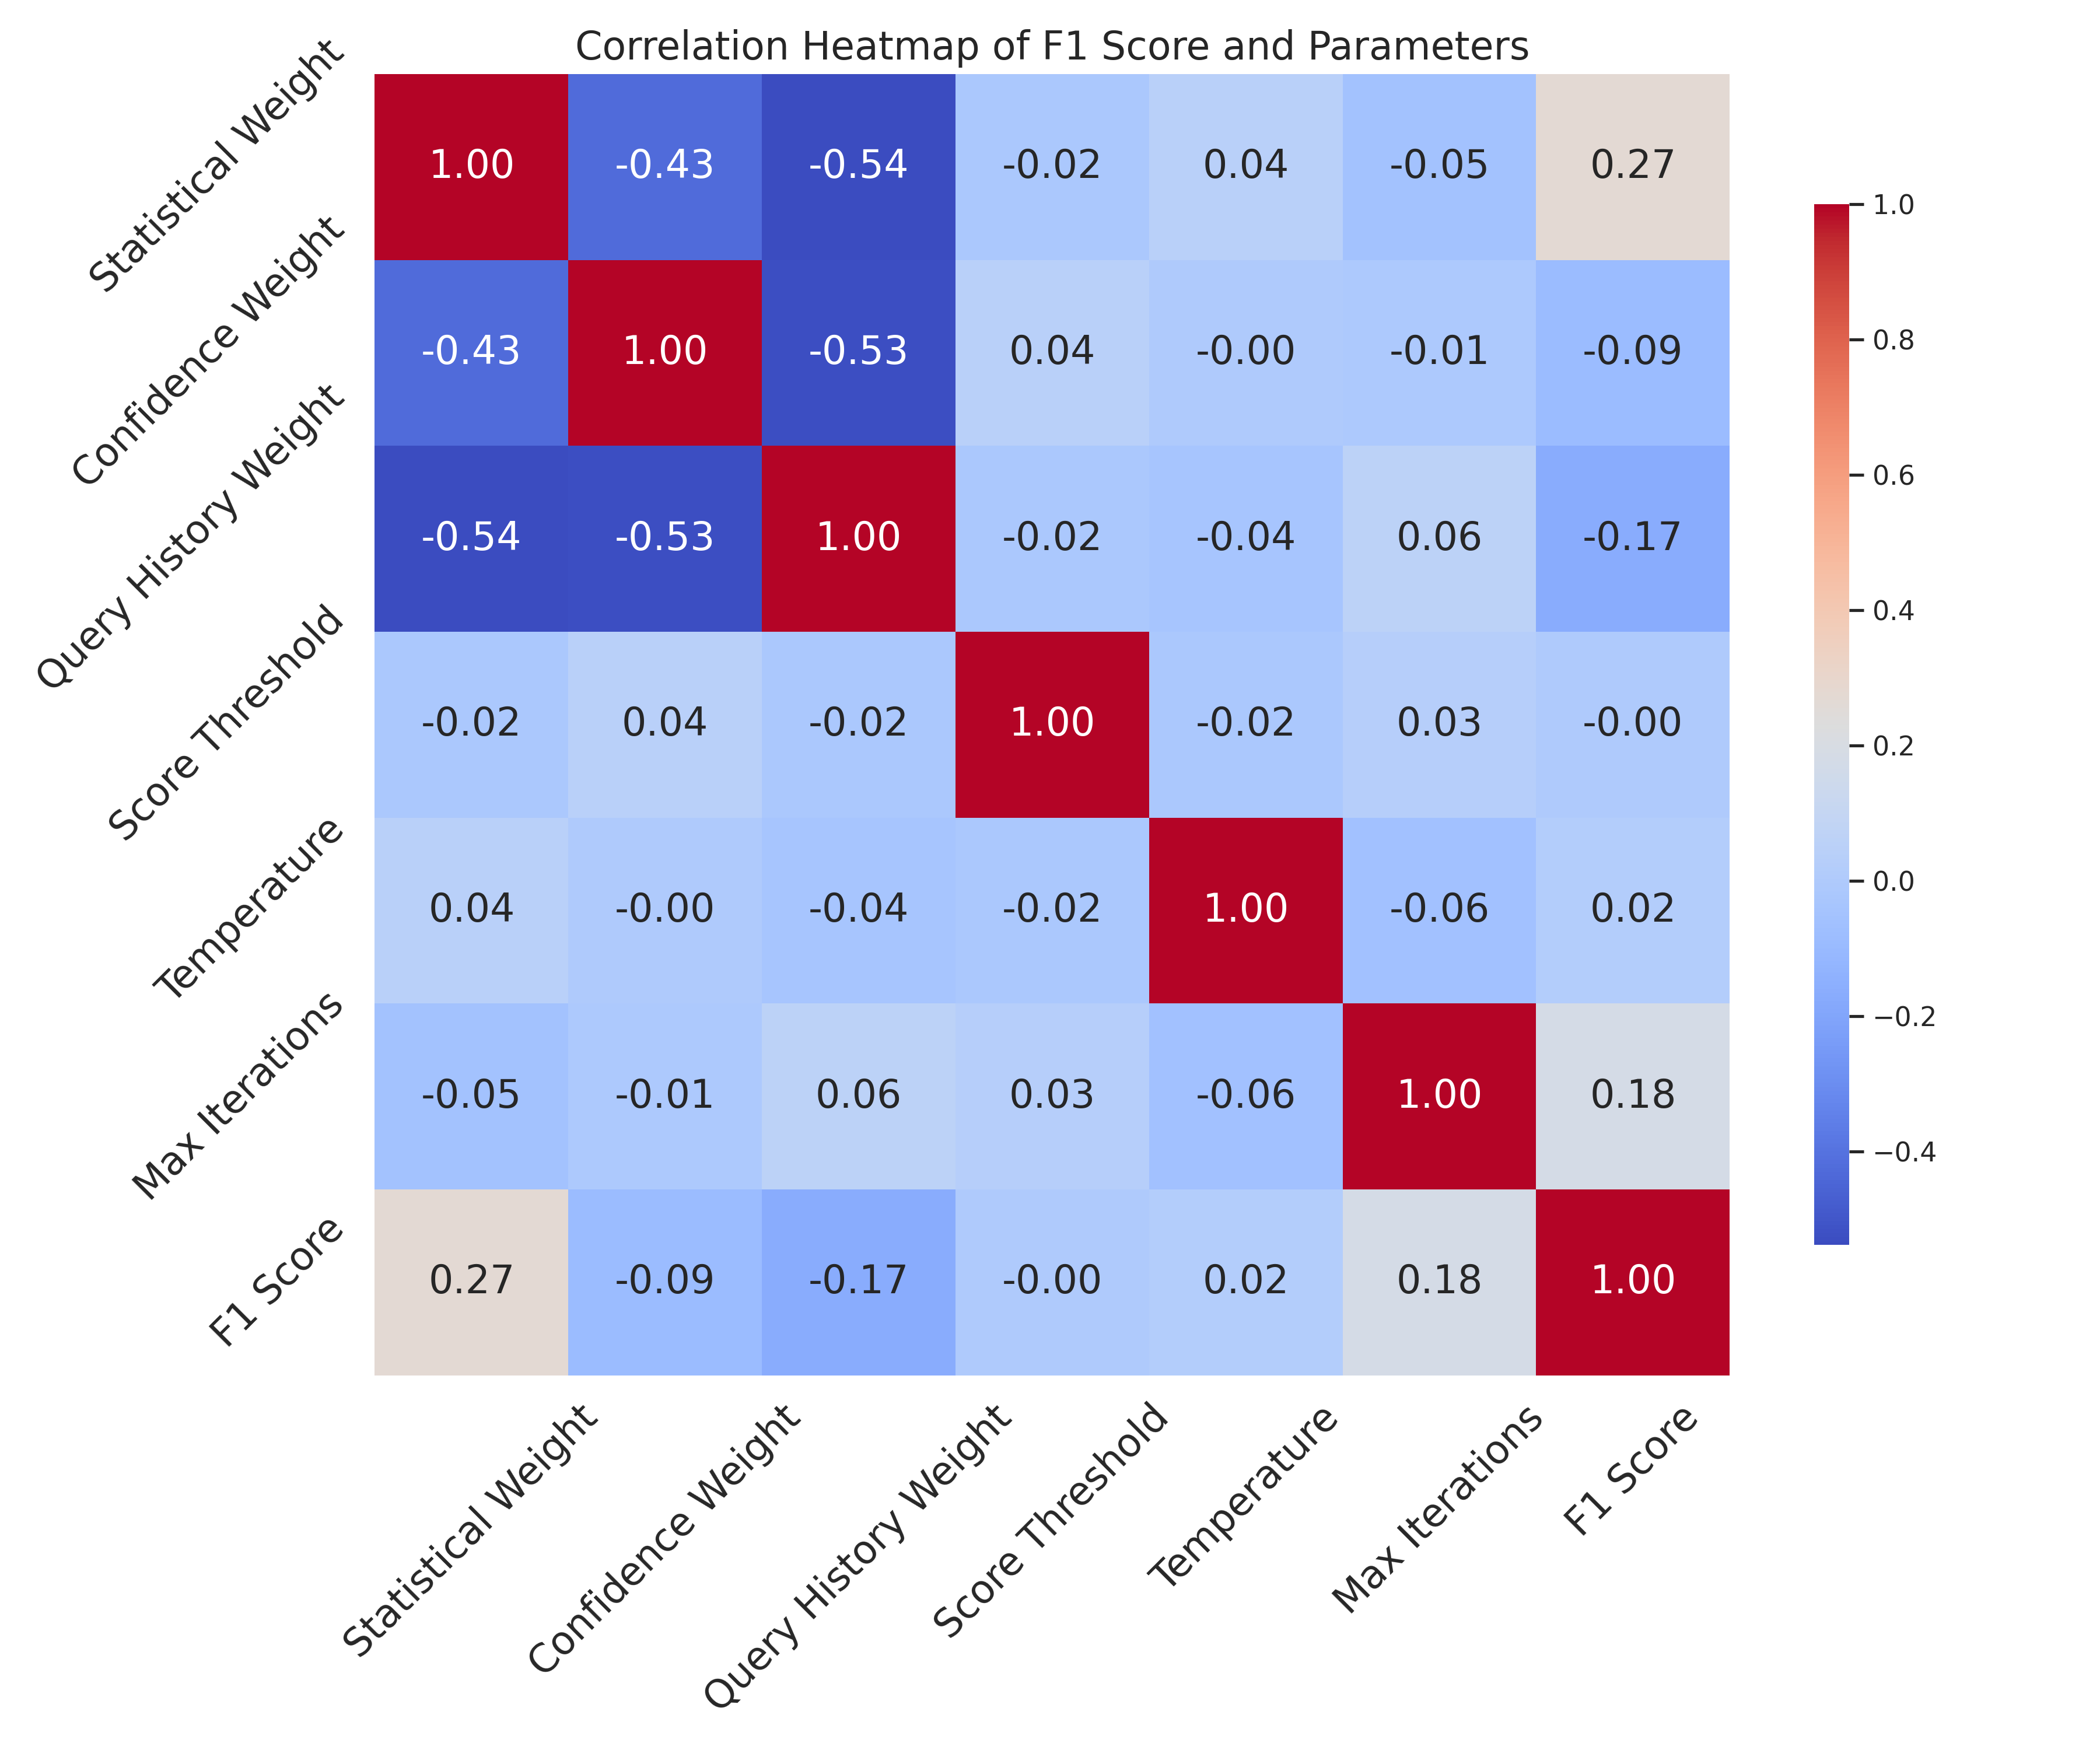
The image is a correlation heatmap visualizing the relationships between the F1 score and several parameters: Statistical Weight, Confidence Weight, Query History Weight, Score Threshold, Temperature, and Max Iterations. The heatmap uses a color gradient from blue (negative correlation) to red (positive correlation), with white indicating near-zero correlation. The values within each cell represent the correlation coefficient between the corresponding parameters.
### Components/Axes
* **Title:** Correlation Heatmap of F1 Score and Parameters
* **X-axis:** Statistical Weight, Confidence Weight, Query History Weight, Score Threshold, Temperature, Max Iterations, F1 Score (labels are rotated 45 degrees)
* **Y-axis:** Statistical Weight, Confidence Weight, Query History Weight, Score Threshold, Temperature, Max Iterations, F1 Score (labels are rotated 45 degrees)
* **Color Scale (Legend):** Ranges from -0.4 (dark blue) to 1.0 (dark red), with intermediate values indicated by a color gradient. The scale includes markers at -0.4, -0.2, 0.0, 0.2, 0.4, 0.6, 0.8, and 1.0.
### Detailed Analysis
The heatmap displays the correlation coefficients between each pair of parameters. The diagonal elements show a perfect positive correlation (1.00) as each parameter is perfectly correlated with itself.
Here's a breakdown of the correlation values:
* **Statistical Weight:**
* With itself: 1.00 (red)
* With Confidence Weight: -0.43 (blue)
* With Query History Weight: -0.54 (dark blue)
* With Score Threshold: -0.02 (light blue)
* With Temperature: 0.04 (light blue)
* With Max Iterations: -0.05 (light blue)
* With F1 Score: 0.27 (light orange)
* **Confidence Weight:**
* With Statistical Weight: -0.43 (blue)
* With itself: 1.00 (red)
* With Query History Weight: -0.53 (dark blue)
* With Score Threshold: 0.04 (light blue)
* With Temperature: -0.00 (light blue)
* With Max Iterations: -0.01 (light blue)
* With F1 Score: -0.09 (light blue)
* **Query History Weight:**
* With Statistical Weight: -0.54 (dark blue)
* With Confidence Weight: -0.53 (dark blue)
* With itself: 1.00 (red)
* With Score Threshold: -0.02 (light blue)
* With Temperature: -0.04 (light blue)
* With Max Iterations: 0.06 (light blue)
* With F1 Score: -0.17 (light blue)
* **Score Threshold:**
* With Statistical Weight: -0.02 (light blue)
* With Confidence Weight: 0.04 (light blue)
* With Query History Weight: -0.02 (light blue)
* With itself: 1.00 (red)
* With Temperature: -0.02 (light blue)
* With Max Iterations: 0.03 (light blue)
* With F1 Score: -0.00 (light blue)
* **Temperature:**
* With Statistical Weight: 0.04 (light blue)
* With Confidence Weight: -0.00 (light blue)
* With Query History Weight: -0.04 (light blue)
* With Score Threshold: -0.02 (light blue)
* With itself: 1.00 (red)
* With Max Iterations: -0.06 (light blue)
* With F1 Score: 0.02 (light blue)
* **Max Iterations:**
* With Statistical Weight: -0.05 (light blue)
* With Confidence Weight: -0.01 (light blue)
* With Query History Weight: 0.06 (light blue)
* With Score Threshold: 0.03 (light blue)
* With Temperature: -0.06 (light blue)
* With itself: 1.00 (red)
* With F1 Score: 0.18 (light orange)
* **F1 Score:**
* With Statistical Weight: 0.27 (light orange)
* With Confidence Weight: -0.09 (light blue)
* With Query History Weight: -0.17 (light blue)
* With Score Threshold: -0.00 (light blue)
* With Temperature: 0.02 (light blue)
* With Max Iterations: 0.18 (light orange)
* With itself: 1.00 (red)
### Key Observations
* Statistical Weight, Confidence Weight, and Query History Weight show strong negative correlations with each other (approximately -0.43 to -0.54).
* The remaining parameters (Score Threshold, Temperature, Max Iterations) show very weak correlations with each other and with Confidence Weight, Score Threshold, and Temperature (close to 0).
* F1 Score has a slight positive correlation with Statistical Weight (0.27) and Max Iterations (0.18), and a slight negative correlation with Query History Weight (-0.17).
### Interpretation
The heatmap suggests that Statistical Weight, Confidence Weight, and Query History Weight are inversely related; increasing one tends to decrease the others. The other parameters have little to no linear relationship with each other. The F1 score is weakly positively correlated with Statistical Weight and Max Iterations, suggesting that increasing these parameters might slightly improve the F1 score, while increasing Query History Weight might slightly decrease it. However, these correlations are weak, so the effects may not be significant. The heatmap provides insights into potential parameter interactions and their impact on the F1 score, which can be valuable for optimizing model performance.