## Heatmap: Correlation Heatmap of F1 Score and Parameters
### Overview
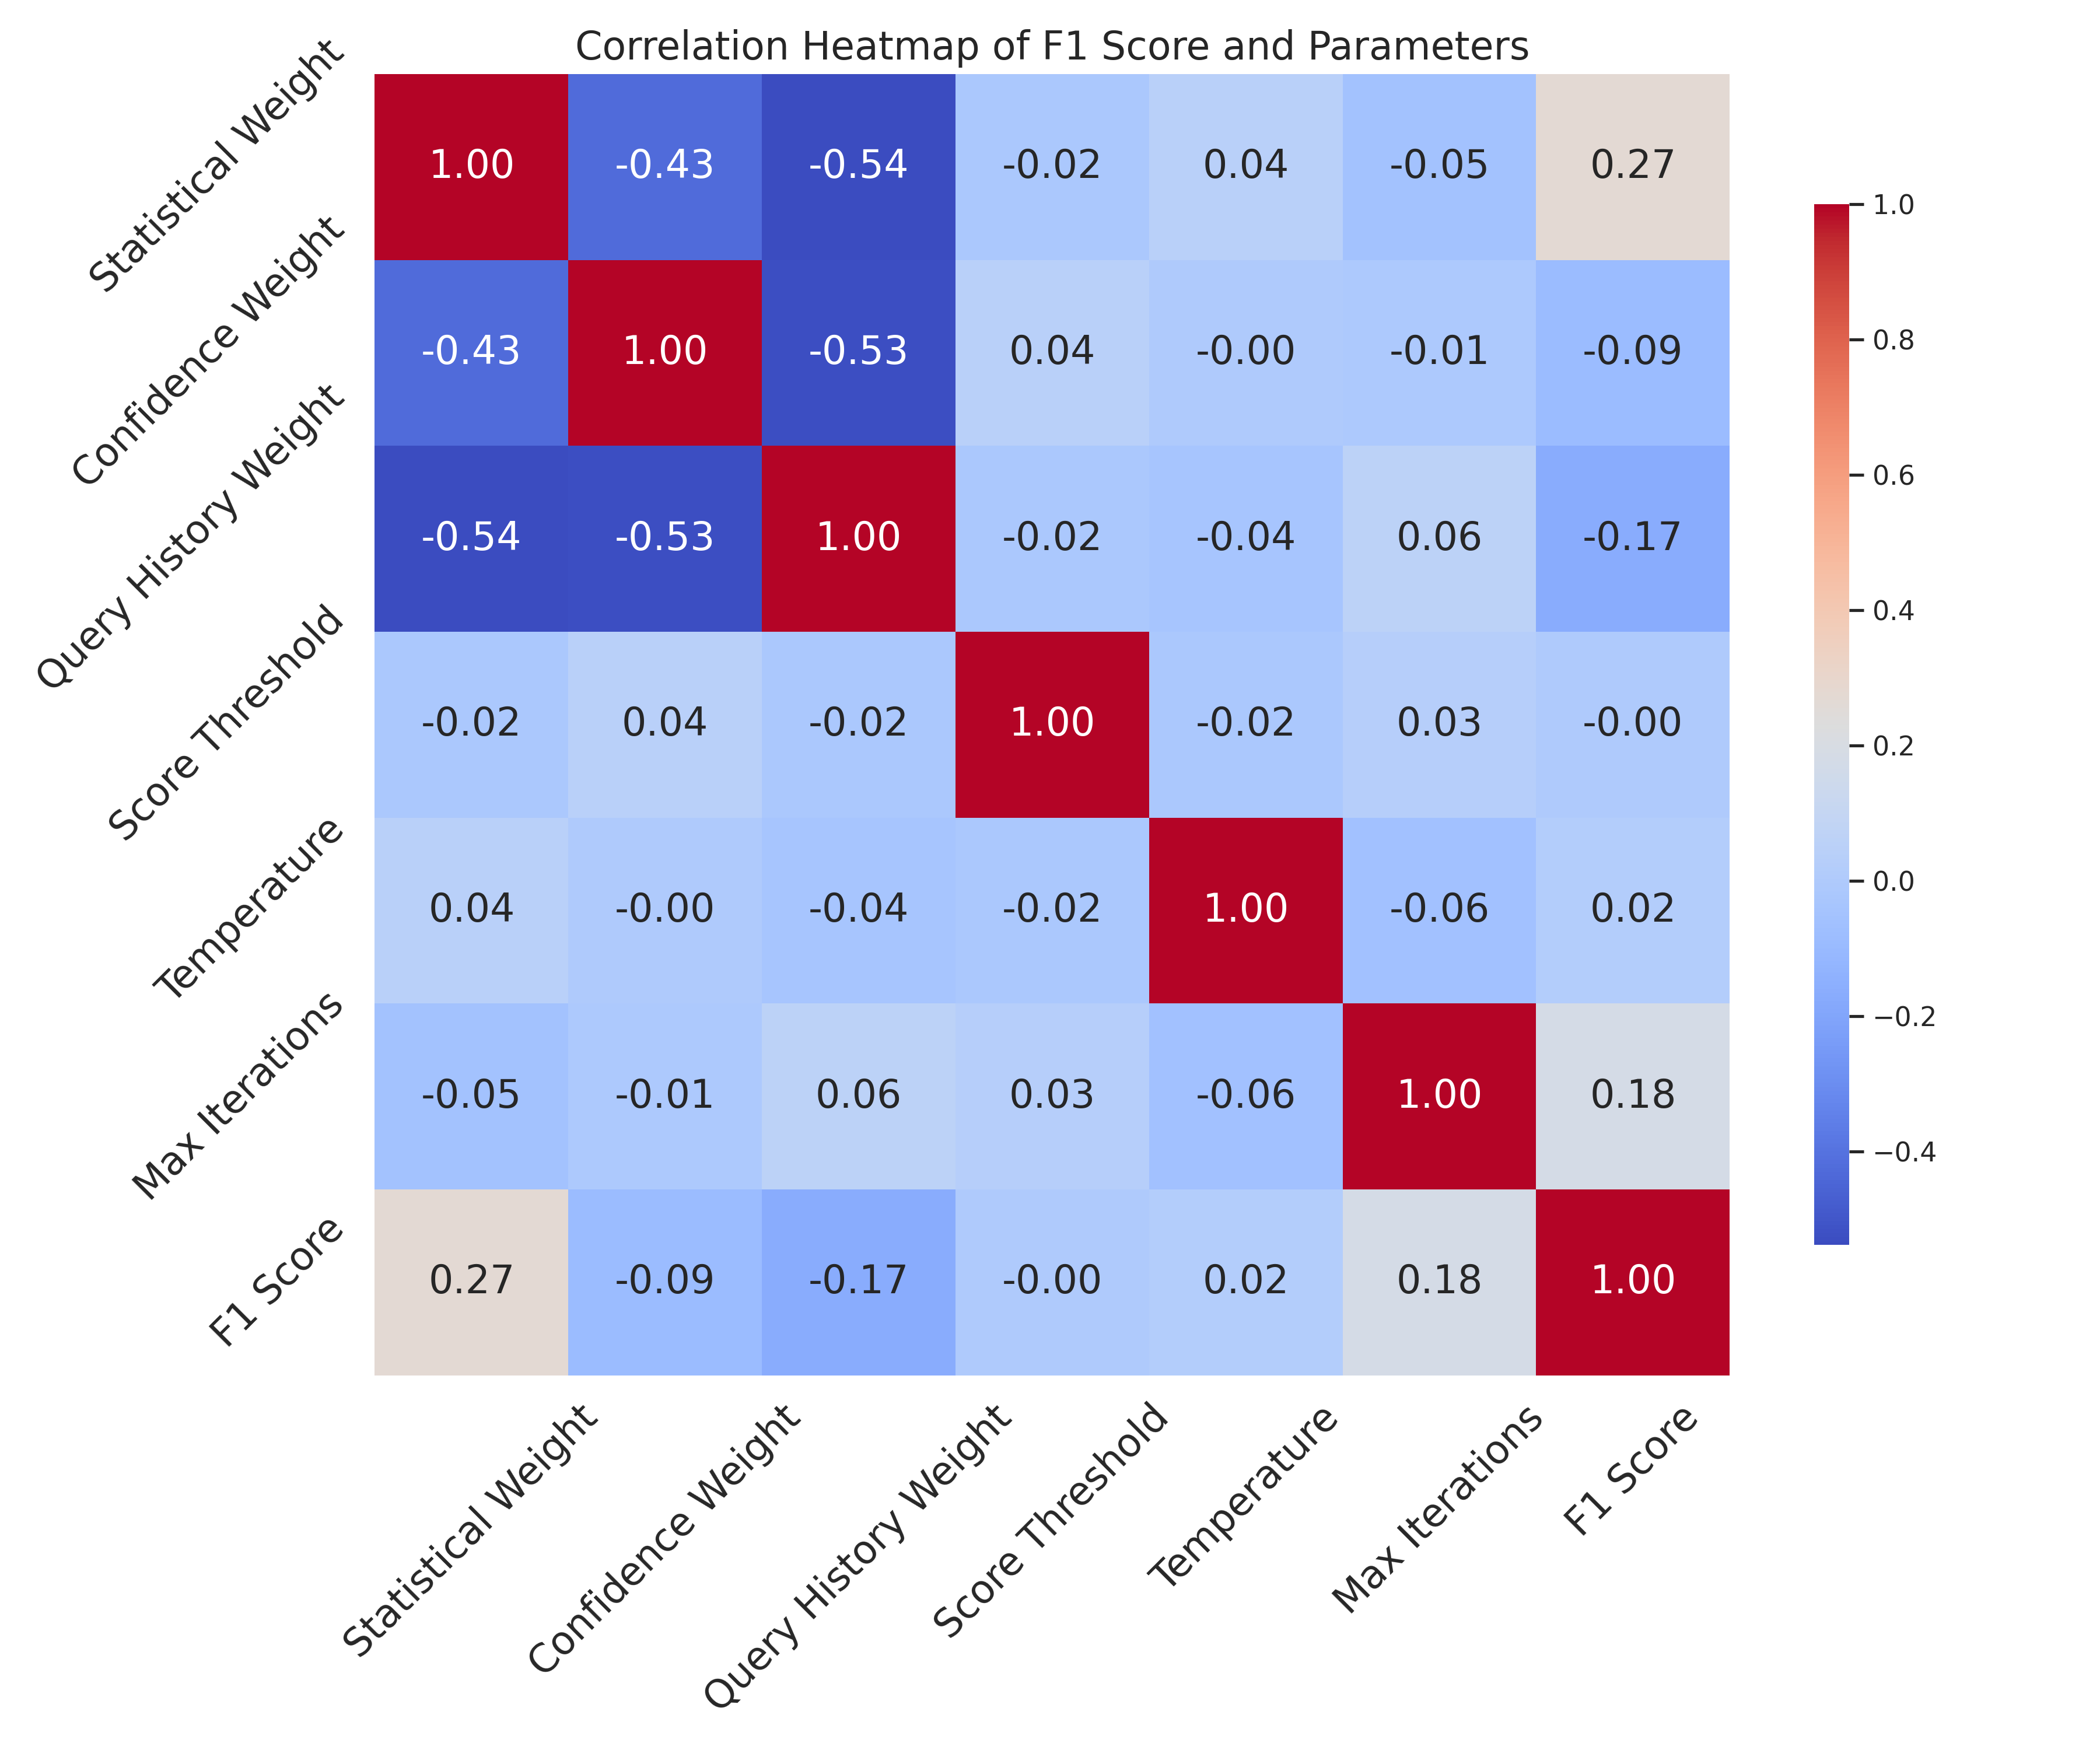
The image presents a correlation heatmap visualizing the relationships between the F1 Score and several parameters: Statistical Weight, Confidence Weight, Query History Weight, Score Threshold, Temperature, and Max Iterations. The heatmap uses a color scale to represent the correlation coefficients, ranging from -1.0 to 1.0.
### Components/Axes
* **Title:** "Correlation Heatmap of F1 Score and Parameters" (Top-center)
* **X-axis:** Parameters: Statistical Weight, Confidence Weight, Query History Weight, Score Threshold, Temperature, Max Iterations, F1 Score. (Bottom)
* **Y-axis:** Parameters: Statistical Weight, Confidence Weight, Query History Weight, Score Threshold, Temperature, Max Iterations, F1 Score. (Left)
* **Color Scale/Legend:** Located on the right side of the heatmap.
* -1.0 (Dark Blue)
* -0.8
* -0.6
* -0.4
* -0.2
* 0.0 (White)
* 0.2
* 0.4
* 0.6
* 0.8
* 1.0 (Dark Red)
### Detailed Analysis
The heatmap is a 7x7 grid, with each cell representing the correlation coefficient between two parameters. The diagonal elements are all 1.0, indicating perfect self-correlation.
Here's a breakdown of the correlation coefficients:
* **Statistical Weight:**
* Correlates negatively with Confidence Weight (-0.43) and Query History Weight (-0.54).
* Correlates positively with F1 Score (0.27).
* **Confidence Weight:**
* Correlates negatively with Statistical Weight (-0.43) and Query History Weight (-0.53).
* Correlates negatively with F1 Score (-0.09).
* **Query History Weight:**
* Correlates negatively with Statistical Weight (-0.54) and Confidence Weight (-0.53).
* Correlates negatively with F1 Score (-0.17).
* **Score Threshold:**
* Shows very weak correlations with all parameters (close to 0.0).
* **Temperature:**
* Shows very weak correlations with all parameters (close to 0.0).
* **Max Iterations:**
* Shows weak positive correlation with F1 Score (0.18).
* **F1 Score:**
* Correlates positively with Statistical Weight (0.27) and Max Iterations (0.18).
* Correlates negatively with Confidence Weight (-0.09) and Query History Weight (-0.17).
The strongest negative correlations are between Statistical Weight and Query History Weight (-0.54), and between Confidence Weight and Query History Weight (-0.53).
### Key Observations
* There's a noticeable negative correlation between Statistical Weight and Query History Weight, suggesting that as the importance of statistical evidence increases, the influence of query history decreases, and vice versa.
* The F1 Score shows a modest positive correlation with Statistical Weight and Max Iterations, and a slight negative correlation with Confidence Weight and Query History Weight.
* Score Threshold and Temperature exhibit very weak correlations with all other parameters, indicating they have minimal impact on the relationships observed.
* The heatmap is largely symmetrical, as expected for a correlation matrix.
### Interpretation
The heatmap suggests that the F1 Score is most influenced by Statistical Weight and Max Iterations. Increasing the weight given to statistical evidence and allowing for more iterations during the process tend to improve the F1 Score. Conversely, relying heavily on confidence weight or query history might slightly decrease the F1 Score.
The strong negative correlation between Statistical Weight and Query History Weight indicates a trade-off between leveraging past interactions and relying on objective statistical evidence. A system designer would need to carefully balance these two factors to optimize performance.
The near-zero correlations involving Score Threshold and Temperature suggest these parameters are not significant drivers of the observed relationships, or that their effects are masked by other factors. Further investigation might be needed to understand their role, or they could be considered less critical tuning parameters.
The overall pattern suggests a complex interplay between the parameters, where no single factor dominates the F1 Score. A holistic approach to parameter tuning, considering the correlations between them, is likely to be more effective than optimizing each parameter in isolation.