\n
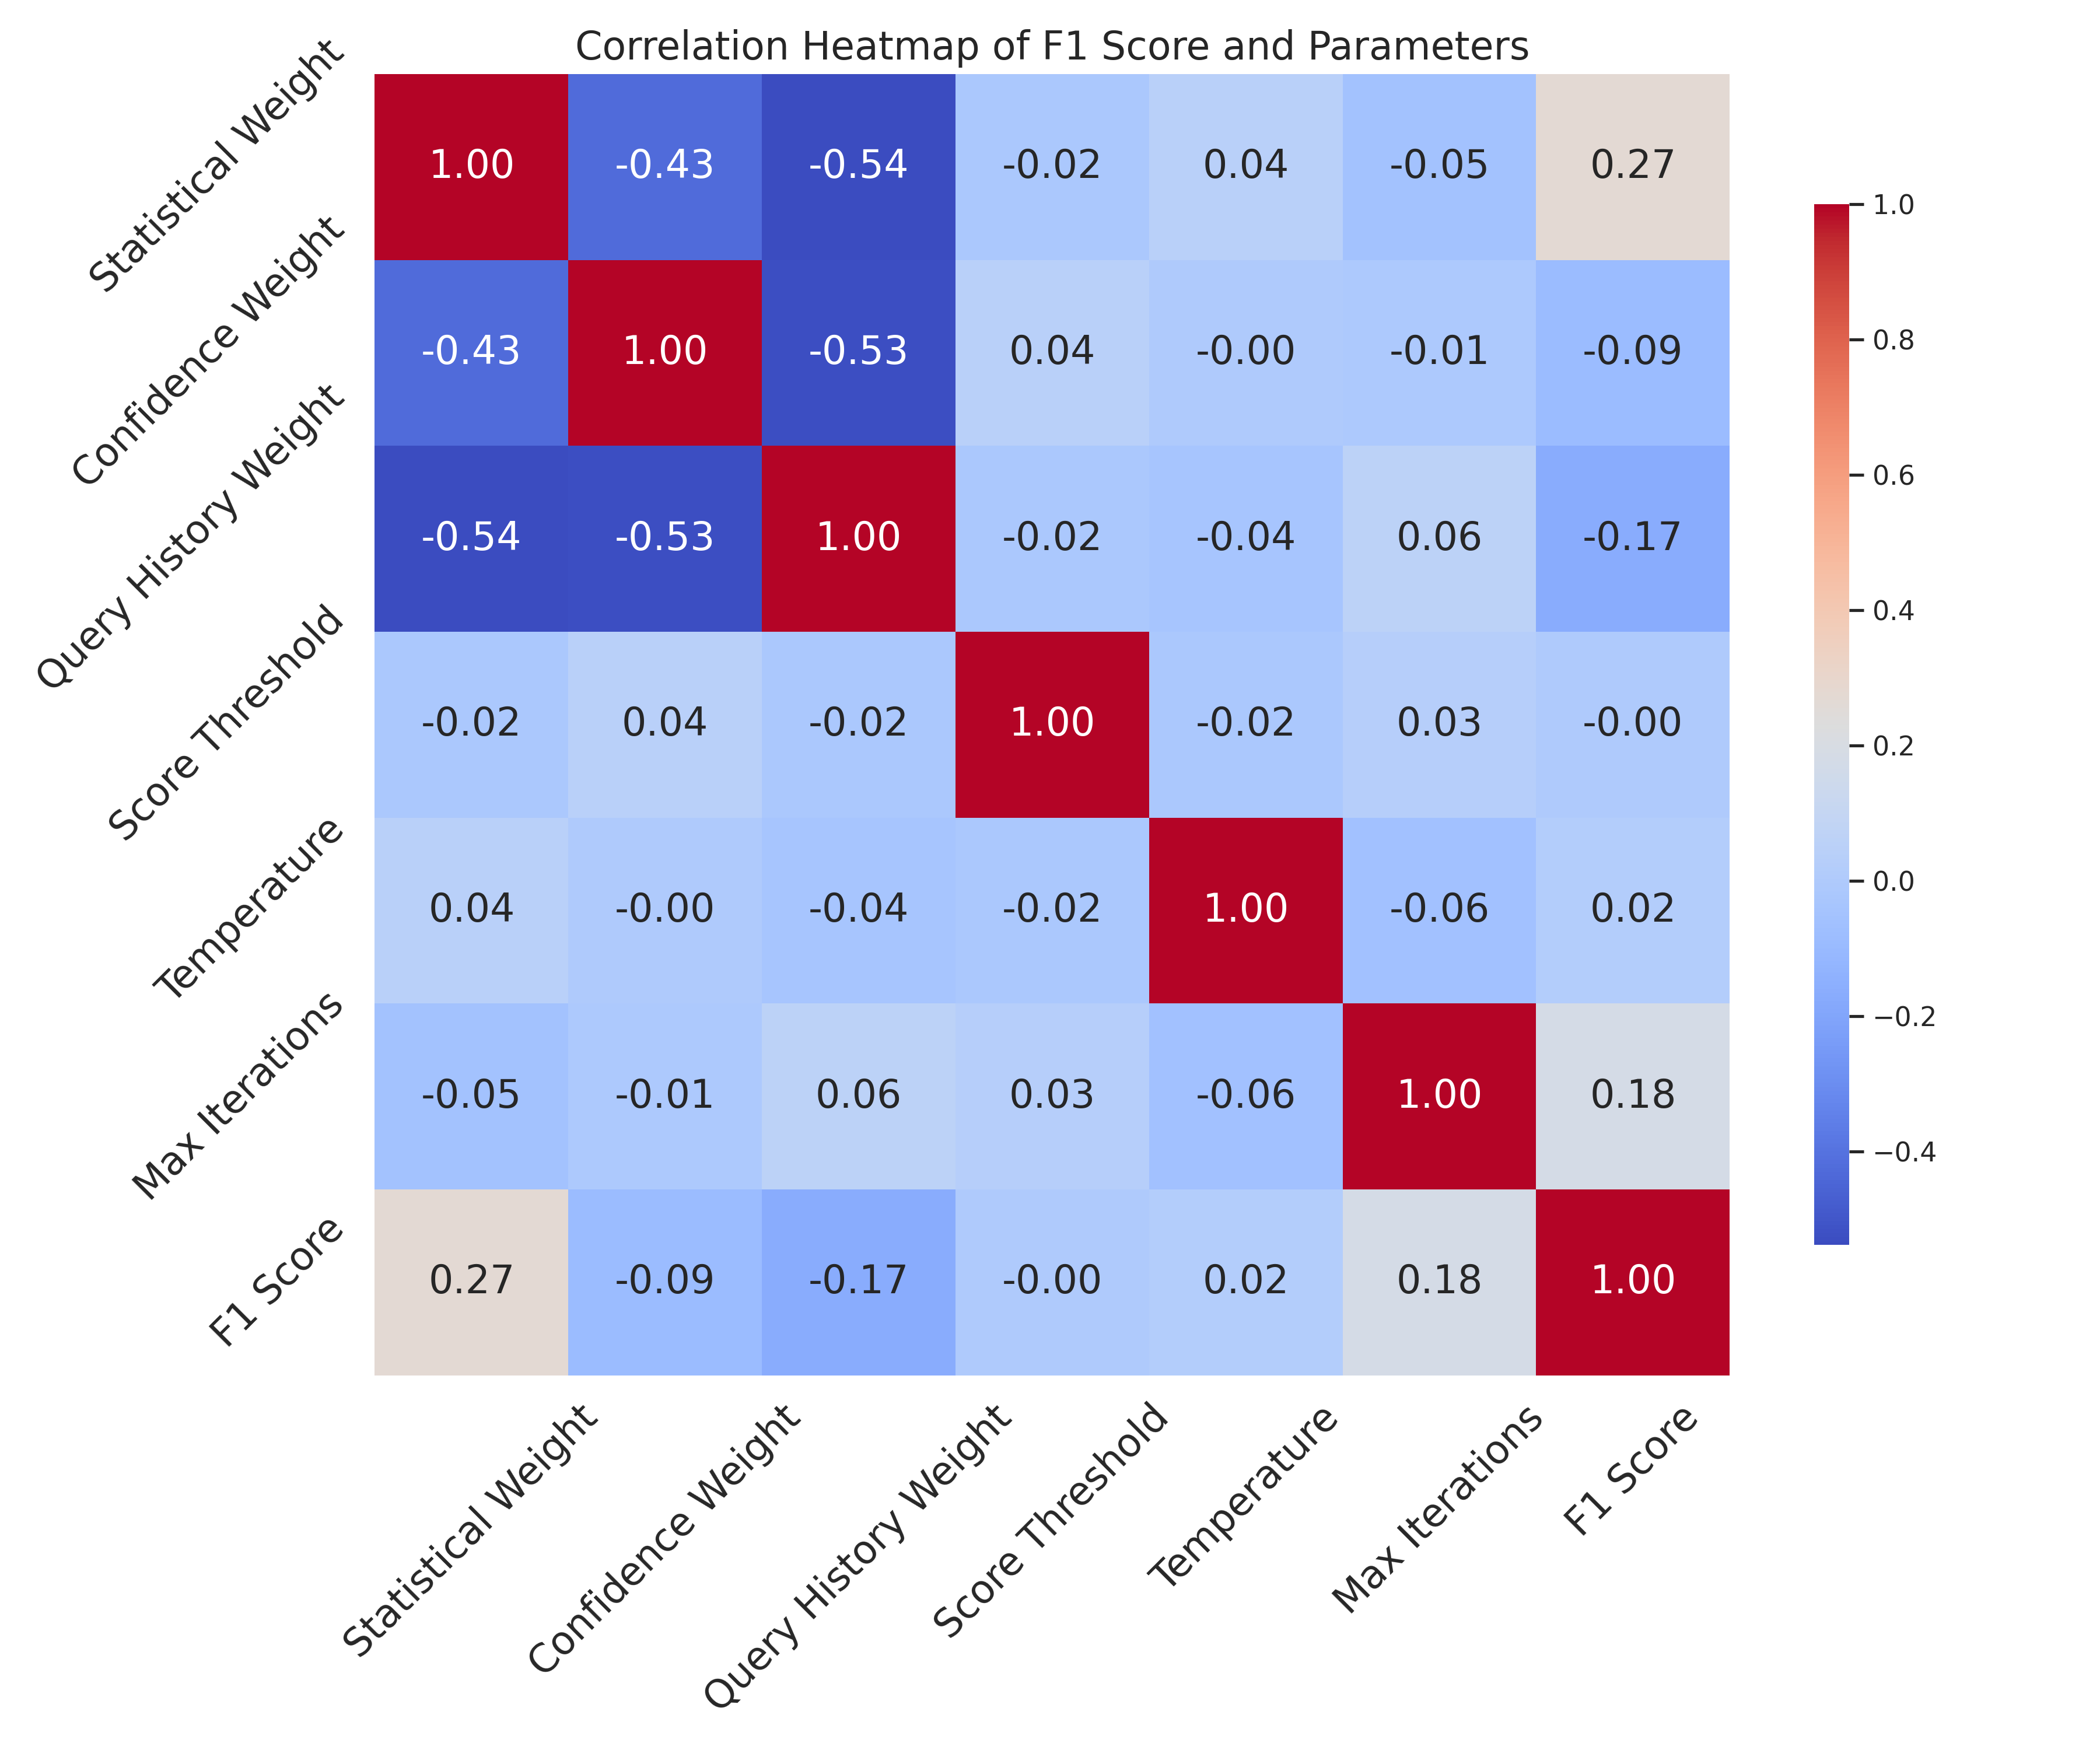
## Correlation Heatmap: F1 Score and Parameters
### Overview
The image is a correlation heatmap titled "Correlation Heatmap of F1 Score and Parameters." It visualizes the Pearson correlation coefficients between seven variables: six model/hyperparameters and the F1 Score performance metric. The heatmap uses a diverging color scale from blue (negative correlation) to red (positive correlation) to represent the strength and direction of linear relationships.
### Components/Axes
* **Title:** "Correlation Heatmap of F1 Score and Parameters" (centered at the top).
* **Axes Labels:** Both the vertical (Y) and horizontal (X) axes list the same seven variables in the same order. The labels are rotated approximately 45 degrees for readability.
* **Variables (in order from top/left):**
1. Statistical Weight
2. Confidence Weight
3. Query History Weight
4. Score Threshold
5. Temperature
6. Max Iterations
7. F1 Score
* **Color Scale/Legend:** A vertical color bar is positioned on the right side of the heatmap.
* **Scale Range:** Approximately -0.4 to 1.0.
* **Color Mapping:** Deep blue represents strong negative correlation (~-0.4), transitioning through light blue/white (near 0.0) to deep red for strong positive correlation (1.0).
* **Tick Marks:** The scale has labeled tick marks at -0.4, -0.2, 0.0, 0.2, 0.4, 0.6, 0.8, and 1.0.
### Detailed Analysis
The heatmap is a 7x7 symmetric matrix. The diagonal entries are all 1.00 (deep red), representing perfect correlation of each variable with itself. The off-diagonal entries show the pairwise correlations.
**Complete Correlation Matrix (Row-wise from top):**
| Variable (Row) | Statistical Weight | Confidence Weight | Query History Weight | Score Threshold | Temperature | Max Iterations | F1 Score |
| :--- | :---: | :---: | :---: | :---: | :---: | :---: | :---: |
| **Statistical Weight** | 1.00 | -0.43 | -0.54 | -0.02 | 0.04 | -0.05 | 0.27 |
| **Confidence Weight** | -0.43 | 1.00 | -0.53 | 0.04 | -0.00 | -0.01 | -0.09 |
| **Query History Weight** | -0.54 | -0.53 | 1.00 | -0.02 | -0.04 | 0.06 | -0.17 |
| **Score Threshold** | -0.02 | 0.04 | -0.02 | 1.00 | -0.02 | 0.03 | -0.00 |
| **Temperature** | 0.04 | -0.00 | -0.04 | -0.02 | 1.00 | -0.06 | 0.02 |
| **Max Iterations** | -0.05 | -0.01 | 0.06 | 0.03 | -0.06 | 1.00 | 0.18 |
| **F1 Score** | 0.27 | -0.09 | -0.17 | -0.00 | 0.02 | 0.18 | 1.00 |
**Spatial & Color Verification:**
* The strongest **negative** correlations (dark blue cells) are between:
* Statistical Weight and Query History Weight (-0.54).
* Confidence Weight and Query History Weight (-0.53).
* Statistical Weight and Confidence Weight (-0.43).
* The strongest **positive** correlations (aside from the diagonal) are between:
* Statistical Weight and F1 Score (0.27, light beige/red).
* Max Iterations and F1 Score (0.18, light gray/beige).
* Most correlations involving **Score Threshold** and **Temperature** are very weak (close to 0.0, very light blue/white), indicating minimal linear relationship with other parameters.
### Key Observations
1. **Parameter Interdependence:** The three "Weight" parameters (Statistical, Confidence, Query History) are moderately to strongly negatively correlated with each other. This suggests an inverse relationship; increasing one weight tends to be associated with decreasing the others in the observed data.
2. **F1 Score Drivers:** The F1 Score shows its strongest positive correlation with **Statistical Weight (0.27)**, followed by **Max Iterations (0.18)**. It has a weak negative correlation with **Query History Weight (-0.17)**.
3. **Isolated Parameters:** **Score Threshold** and **Temperature** exhibit near-zero correlation with all other variables, including the F1 Score. This implies their variation is largely independent of the other parameters in this dataset.
4. **Symmetry:** The matrix is perfectly symmetric, as expected for a correlation matrix (e.g., Corr(A,B) = Corr(B,A)).
### Interpretation
This heatmap provides a diagnostic view of parameter interactions and their relationship to model performance (F1 Score) for a specific model or experiment.
* **Trade-offs in Weighting:** The strong negative correlations between the weight parameters suggest a potential trade-off in the model's design. The system may be balancing these three factors against each other; emphasizing statistical evidence might come at the cost of de-emphasizing confidence or query history, and vice-versa.
* **Performance Levers:** The data suggests that **Statistical Weight** is the parameter most positively associated with a higher F1 Score in this context. **Max Iterations** also shows a modest positive link. Tuning these parameters might be the most effective way to improve performance. Conversely, **Query History Weight** has a slight negative association.
* **Parameter Independence:** The lack of correlation for **Score Threshold** and **Temperature** is notable. It indicates that, within the range of values tested, changing these parameters does not systematically affect the other parameters or the final F1 Score. They may be less critical for performance tuning in this specific scenario, or their effects may be non-linear and not captured by this correlation analysis.
* **Causality vs. Correlation:** It is crucial to remember this chart shows correlation, not causation. The observed relationships could be due to the specific dataset, experimental design, or underlying model architecture. For example, the negative correlation between weights might be a designed feature of the algorithm rather than an emergent property.