## Heatmap: Correlation Heatmap of F1 Score and Parameters
### Overview
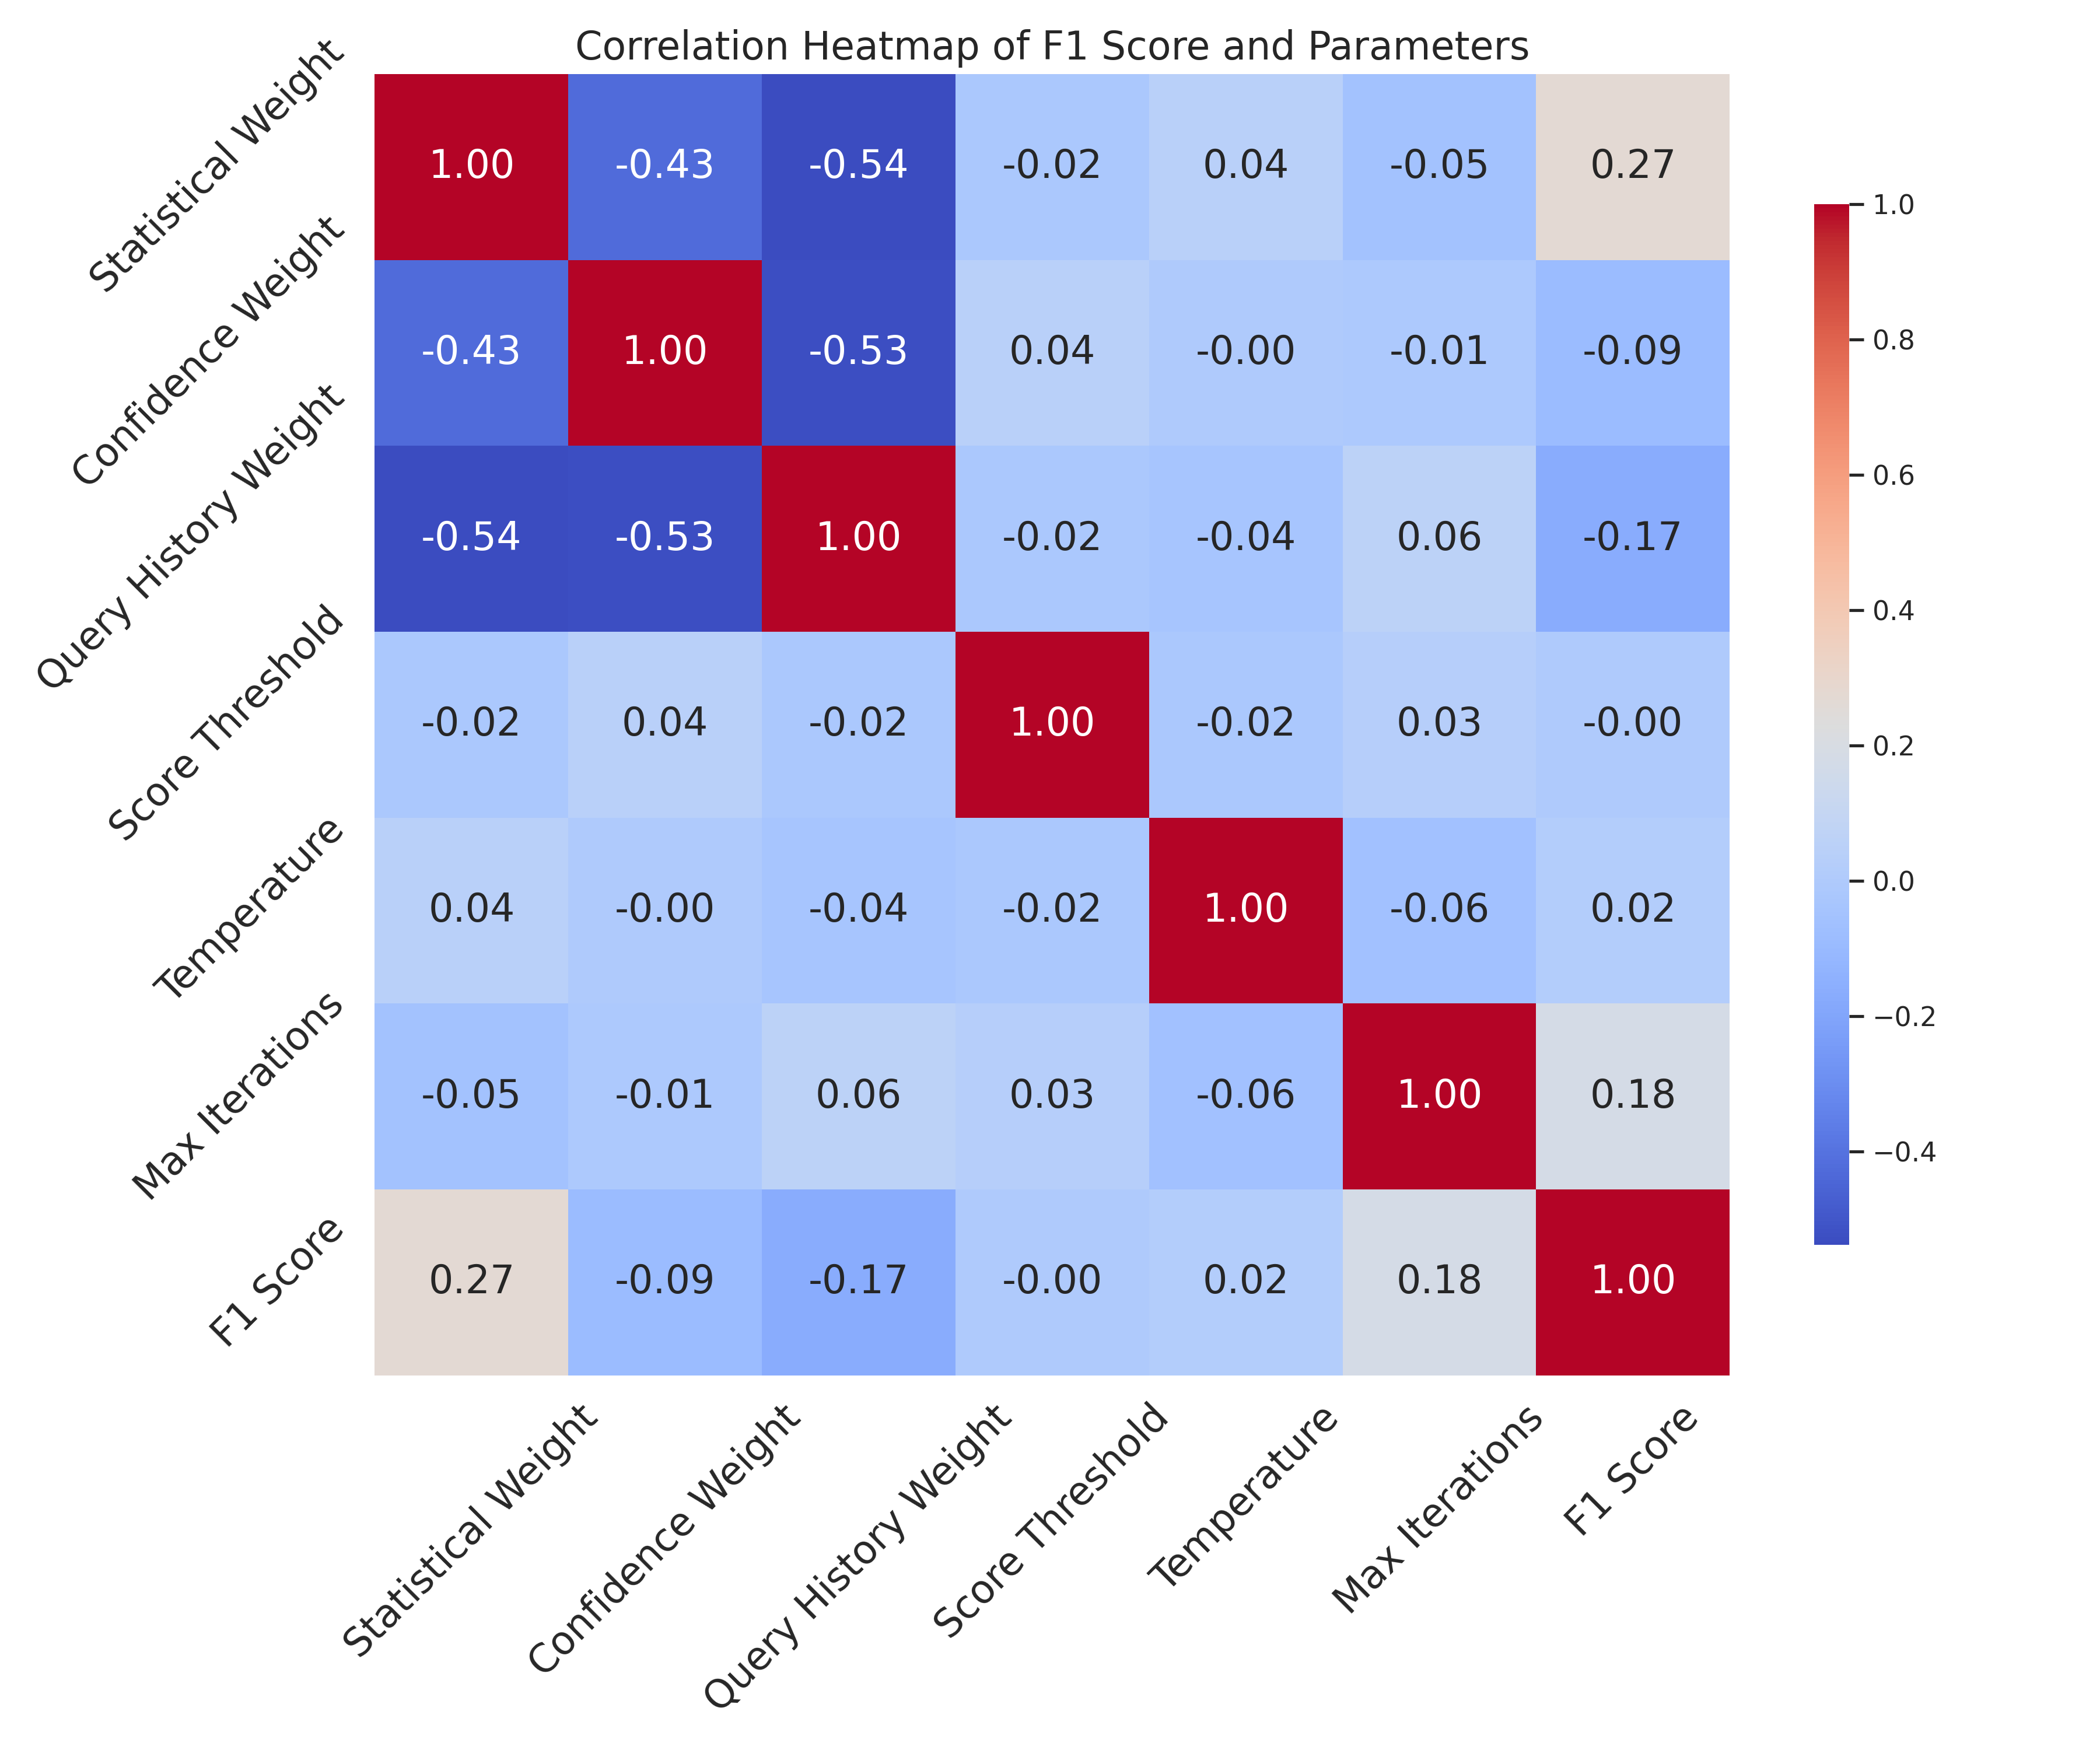
A square correlation heatmap visualizing relationships between 8 parameters (rows) and 8 parameters (columns), including the F1 Score. The color gradient ranges from red (positive correlation) to blue (negative correlation), with values from -0.54 to 1.00. The diagonal shows perfect self-correlations (1.00), while off-diagonal cells reveal parameter relationships.
### Components/Axes
- **X-axis (Parameters)**: Statistical Weight, Confidence Weight, Query History Weight, Score Threshold, Temperature, Max Iterations, F1 Score
- **Y-axis (Parameters)**: Same as X-axis
- **Legend**: Right-aligned colorbar with gradient from red (positive) to blue (negative), labeled with correlation values (-0.54 to 1.00)
- **Text Elements**:
- Title: "Correlation Heatmap of F1 Score and Parameters"
- Axis labels: Parameter names in bold
- Cell values: Correlation coefficients (e.g., 1.00, -0.43)
### Detailed Analysis
1. **Statistical Weight**:
- Self-correlation: 1.00 (red)
- Confidence Weight: -0.43 (blue)
- Query History Weight: -0.54 (dark blue)
- Score Threshold: -0.02 (light blue)
- Temperature: 0.04 (light red)
- Max Iterations: -0.05 (light blue)
- F1 Score: 0.27 (light red)
2. **Confidence Weight**:
- Self-correlation: 1.00 (red)
- Query History Weight: -0.53 (dark blue)
- Score Threshold: 0.04 (light red)
- Temperature: -0.00 (neutral)
- Max Iterations: -0.01 (light blue)
- F1 Score: -0.09 (light blue)
3. **Query History Weight**:
- Self-correlation: 1.00 (red)
- Score Threshold: -0.02 (light blue)
- Temperature: -0.04 (light blue)
- Max Iterations: 0.06 (light red)
- F1 Score: -0.17 (light blue)
4. **Score Threshold**:
- Self-correlation: 1.00 (red)
- Temperature: -0.04 (light blue)
- Max Iterations: 0.03 (light red)
- F1 Score: -0.00 (neutral)
5. **Temperature**:
- Self-correlation: 1.00 (red)
- Max Iterations: -0.06 (light blue)
- F1 Score: 0.02 (light red)
6. **Max Iterations**:
- Self-correlation: 1.00 (red)
- F1 Score: 0.18 (light red)
7. **F1 Score**:
- Self-correlation: 1.00 (red)
- Statistical Weight: 0.27 (light red)
- Confidence Weight: -0.09 (light blue)
- Query History Weight: -0.17 (light blue)
- Score Threshold: 0.02 (light red)
- Temperature: 0.18 (light red)
### Key Observations
1. **Strongest Negative Correlations**:
- Statistical Weight ↔ Query History Weight: -0.54
- Confidence Weight ↔ Query History Weight: -0.53
- Suggests inverse relationships between these parameter pairs
2. **F1 Score Relationships**:
- Moderate positive correlation with Statistical Weight (0.27)
- Weak negative correlation with Query History Weight (-0.17)
- Very weak correlation with Score Threshold (-0.00)
3. **Parameter Clusters**:
- Statistical/Confidence Weights show strong negative correlation (-0.43)
- Query History Weight clusters with negative correlations (-0.53/-0.54)
- Max Iterations and Temperature show weak inter-parameter relationships
### Interpretation
The heatmap reveals that:
1. **Parameter Trade-offs**: Statistical and Confidence Weights exhibit inverse relationships with Query History Weight, suggesting potential trade-offs in system configuration.
2. **F1 Score Drivers**: The moderate positive correlation (0.27) between F1 Score and Statistical Weight indicates that increasing statistical weight may improve F1 performance, though the effect is relatively weak.
3. **Stability Factors**: Score Threshold and Temperature show near-neutral correlations with most parameters, suggesting they may be less influential in the system's behavior.
4. **Iteration Impact**: Max Iterations shows a weak positive correlation with F1 Score (0.18), implying limited benefit from increasing iteration counts.
The color-coded visualization effectively highlights parameter dependencies, with the strongest relationships concentrated in the upper-left quadrant. The diagonal dominance (1.00) confirms expected perfect self-correlations, while off-diagonal values reveal meaningful but generally weak parameter interactions.