## Diagram: RL Training Process for Question Answering
### Overview
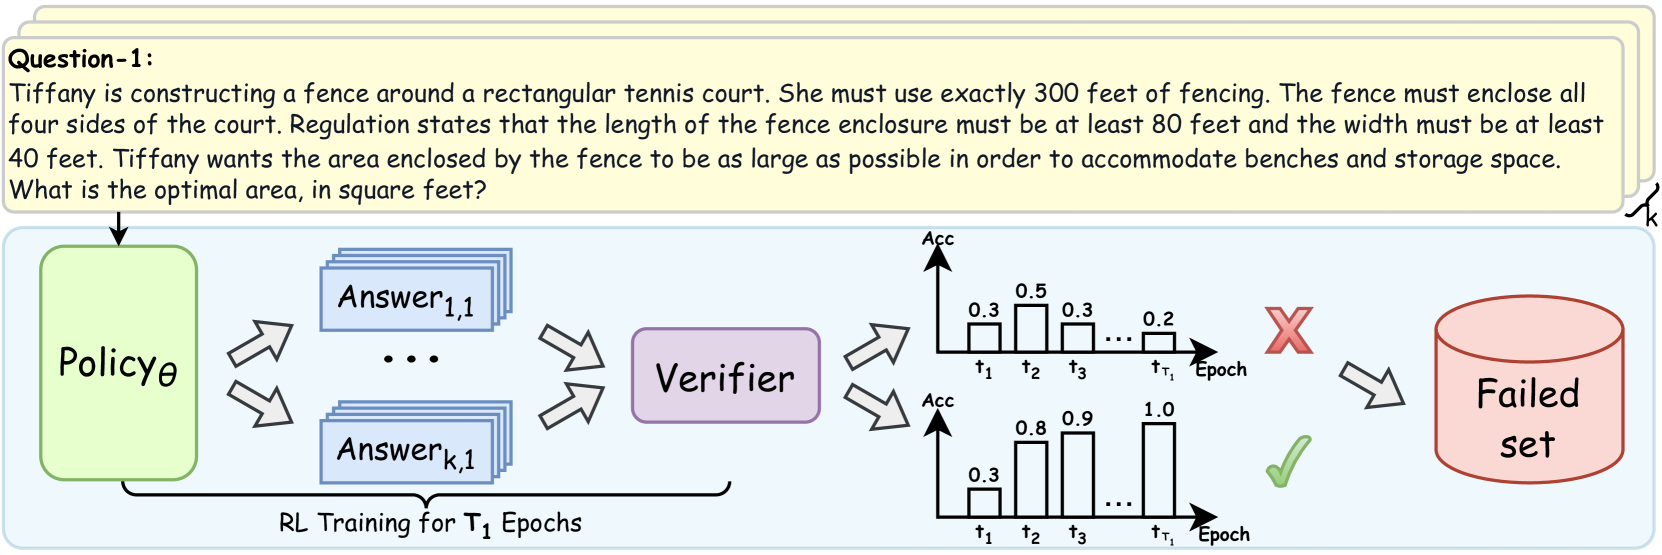
The image depicts a diagram illustrating a reinforcement learning (RL) training process for question answering. It shows how a policy generates answers, which are then verified, and based on the verification result, are either discarded into a "Failed set" or used to improve the policy.
### Components/Axes
* **Question-1:** A text box at the top containing the question: "Tiffany is constructing a fence around a rectangular tennis court. She must use exactly 300 feet of fencing. The fence must enclose all four sides of the court. Regulation states that the length of the fence enclosure must be at least 80 feet and the width must be at least 40 feet. Tiffany wants the area enclosed by the fence to be as large as possible in order to accommodate benches and storage space. What is the optimal area, in square feet?"
* **Policy θ:** A green rounded rectangle labeled "Policy θ". This represents the RL agent's policy.
* **Answer 1,1 ... Answer k,1:** Blue rectangles stacked to represent multiple answers generated by the policy.
* **Verifier:** A purple rounded rectangle labeled "Verifier". This component evaluates the generated answers.
* **Failed set:** A red cylinder labeled "Failed set". This represents the collection of answers that did not pass verification.
* **RL Training for T₁ Epochs:** Text at the bottom indicating the training duration.
* **Top Chart:** A bar chart labeled with "Acc" on the y-axis and "Epoch" on the x-axis. The x-axis is marked with t1, t2, t3, ..., tT1. The bars have heights of approximately 0.3, 0.5, 0.3, ..., 0.2.
* **Bottom Chart:** A bar chart labeled with "Acc" on the y-axis and "Epoch" on the x-axis. The x-axis is marked with t1, t2, t3, ..., tT1. The bars have heights of approximately 0.3, 0.8, 0.9, ..., 1.0.
* **Red X:** Indicates a failed verification.
* **Green Checkmark:** Indicates a successful verification.
### Detailed Analysis or Content Details
1. **Question:** The question describes a scenario where Tiffany needs to construct a fence around a rectangular tennis court with specific constraints on the total fencing length and minimum dimensions. The goal is to maximize the enclosed area.
2. **Policy θ:** The policy generates multiple answers (Answer 1,1 to Answer k,1) to the question.
3. **Answers:** The answers are fed into the Verifier.
4. **Verifier:** The Verifier evaluates the answers.
5. **Top Chart:** The top chart shows a decreasing trend in accuracy over epochs, starting at 0.3 and ending at 0.2.
6. **Bottom Chart:** The bottom chart shows an increasing trend in accuracy over epochs, starting at 0.3 and ending at 1.0.
7. **Failed Set:** Answers that fail verification are added to the "Failed set".
8. **Training:** The RL training process runs for T₁ epochs.
### Key Observations
* The diagram illustrates a typical RL training loop where a policy generates answers, a verifier evaluates them, and the policy is updated based on the verification results.
* The two charts represent different outcomes of the verification process, one showing decreasing accuracy and the other showing increasing accuracy.
### Interpretation
The diagram demonstrates how reinforcement learning can be applied to question answering. The policy attempts to generate answers, and the verifier provides feedback in the form of a reward signal (implied by the checkmark and X). The policy is then updated to generate better answers over time. The two charts likely represent different training runs or different aspects of the training process, with one showing improvement and the other showing potential issues like overfitting or instability. The "Failed set" is used to store incorrect answers, which could be used for further analysis or to improve the verifier.