## Diagram: Reinforcement Learning Policy Training with Verification
### Overview
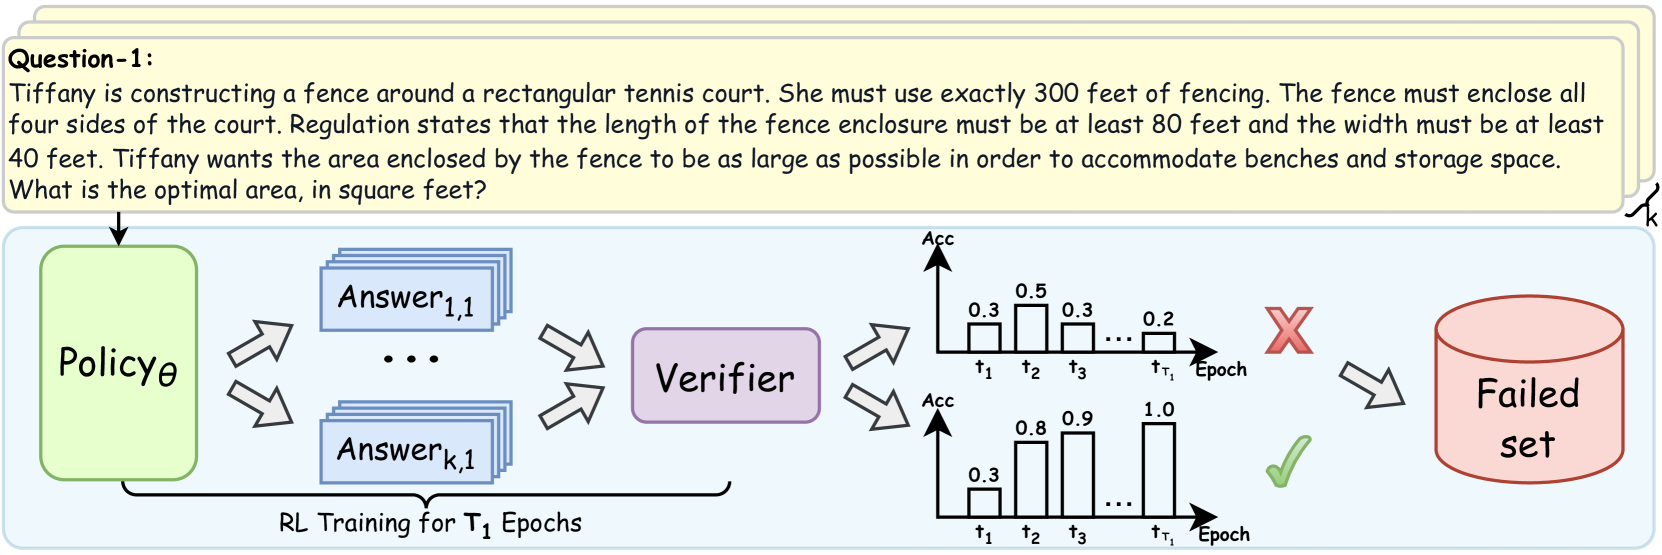
The diagram illustrates a reinforcement learning (RL) training process for a policy (Policyθ) designed to solve a fencing optimization problem. The policy generates answers, which are verified for accuracy. The process includes two training epochs (t₁, t₂, t₃) with corresponding accuracy metrics, a "Failed set" indicator, and a "Verifier" component. The goal is to maximize the enclosed area of a rectangular tennis court using exactly 300 feet of fencing, with constraints on minimum length (80 ft) and width (40 ft).
---
### Components/Axes
1. **Policyθ**: A green box representing the RL policy generating answers.
2. **Verifier**: A purple box evaluating the correctness of answers.
3. **Answer Stacks**: Blue rectangles labeled "Answer₁,₁" to "Answerₖ,₁" representing generated solutions.
4. **Accuracy Graphs**:
- **X-axis**: Training epochs (t₁, t₂, t₃).
- **Y-axis**: Accuracy values (0.0 to 1.0).
- **Legend**: Red "X" (failed) and green "✓" (successful).
5. **Failed Set**: A red cylinder labeled "Failed set" indicating rejected answers.
---
### Detailed Analysis
#### Accuracy Trends
- **First Training Epoch (t₁)**:
- Accuracy values: 0.3, 0.5, 0.3, 0.2.
- **Trend**: Low and inconsistent accuracy, with a final value of 0.2 (red "X" indicating failure).
- **Second Training Epoch (t₁ to t₃)**:
- Accuracy values: 0.3 → 0.8 → 0.9 → 1.0.
- **Trend**: Steady improvement, culminating in perfect accuracy (1.0) by t₃ (green "✓" indicating success).
#### Spatial Grounding
- **Accuracy Graphs**: Positioned to the right of the policy/verifier flowchart.
- **Legend**: Located above the accuracy graphs, with red "X" (failed) and green "✓" (successful).
- **Failed Set**: Positioned to the far right, connected to the first epoch's failure.
---
### Key Observations
1. **Initial Failure**: The first epoch (t₁) shows poor performance, with accuracy dropping to 0.2, leading to a "Failed set."
2. **Improvement with Retraining**: Subsequent epochs (t₂, t₃) demonstrate significant accuracy gains, reaching 1.0 by the final epoch.
3. **Verifier Role**: The verifier acts as a feedback mechanism, rejecting low-accuracy answers and enabling policy refinement.
---
### Interpretation
The diagram demonstrates how RL policies improve iteratively through verification feedback. The initial failure (t₁) highlights the need for retraining, while the subsequent accuracy surge (t₂–t₃) underscores the effectiveness of the RL process. The "Failed set" and verifier interaction suggest a mechanism to discard invalid solutions, ensuring only high-accuracy answers propagate. This aligns with the fencing problem's constraints, where optimal area maximization requires precise policy adjustments. The perfect accuracy in the final epoch implies the policy successfully learned to balance fencing length and area constraints.