## Box Plot: Harmlessness Score Comparison
### Overview
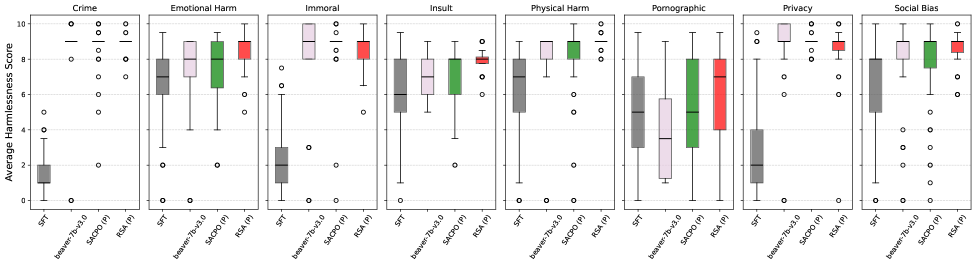
The image presents a series of box plots comparing the average harmlessness scores assigned by different models (SFT, beaver-7b-v3.0, SACPO (P), and RSA (P)) across various categories: Crime, Emotional Harm, Immoral, Insult, Physical Harm, Pornographic, Privacy, and Social Bias. The y-axis represents the average harmlessness score, ranging from 0 to 10. Each category has a separate box plot showing the distribution of harmlessness scores for each model.
### Components/Axes
* **Y-axis:** Average Harmlessness Score (scale from 0 to 10, with gridlines at each integer value).
* **X-axis:** Models (SFT, beaver-7b-v3.0, SACPO (P), RSA (P)) for each category.
* **Categories:** Crime, Emotional Harm, Immoral, Insult, Physical Harm, Pornographic, Privacy, Social Bias.
* **Box Plot Elements:** Each box plot displays the median (horizontal line within the box), the interquartile range (the box itself), and whiskers extending to the data range, with outliers represented as individual circles.
* **Model Colors:**
* SFT: Gray
* beaver-7b-v3.0: Light Purple
* SACPO (P): Green
* RSA (P): Red
### Detailed Analysis
**1. Crime:**
* SFT (Gray): The box plot is concentrated near the bottom, with a median around 1.5. Several outliers are present between 2 and 5.
* beaver-7b-v3.0 (Light Purple): The box plot is centered around 9, with outliers at 8 and 10.
* SACPO (P) (Green): The box plot is centered around 9, with outliers at 8 and 10.
* RSA (P) (Red): The box plot is centered around 9, with outliers at 8 and 10.
**2. Emotional Harm:**
* SFT (Gray): The box plot ranges from approximately 2 to 8, with a median around 7.
* beaver-7b-v3.0 (Light Purple): The box plot ranges from approximately 6 to 9, with a median around 8.
* SACPO (P) (Green): The box plot ranges from approximately 6 to 9.5, with a median around 8.
* RSA (P) (Red): The box plot ranges from approximately 7 to 9.5, with a median around 9.
**3. Immoral:**
* SFT (Gray): The box plot ranges from approximately 1 to 7, with a median around 4.
* beaver-7b-v3.0 (Light Purple): The box plot ranges from approximately 7 to 10, with a median around 9.
* SACPO (P) (Green): The box plot ranges from approximately 7 to 10, with a median around 9.
* RSA (P) (Red): The box plot ranges from approximately 6 to 10, with a median around 8.5.
**4. Insult:**
* SFT (Gray): The box plot ranges from approximately 2 to 8, with a median around 6.
* beaver-7b-v3.0 (Light Purple): The box plot ranges from approximately 4 to 9, with a median around 7.
* SACPO (P) (Green): The box plot ranges from approximately 5 to 9, with a median around 7.5.
* RSA (P) (Red): The box plot ranges from approximately 6 to 10, with a median around 9.
**5. Physical Harm:**
* SFT (Gray): The box plot ranges from approximately 0 to 8, with a median around 6.
* beaver-7b-v3.0 (Light Purple): The box plot ranges from approximately 6 to 9, with a median around 8.
* SACPO (P) (Green): The box plot ranges from approximately 6 to 9.5, with a median around 8.5.
* RSA (P) (Red): The box plot ranges from approximately 7 to 10, with a median around 9.
**6. Pornographic:**
* SFT (Gray): The box plot ranges from approximately 2 to 8, with a median around 6.
* beaver-7b-v3.0 (Light Purple): The box plot ranges from approximately 3 to 8, with a median around 6.
* SACPO (P) (Green): The box plot ranges from approximately 5 to 9, with a median around 7.
* RSA (P) (Red): The box plot ranges from approximately 6 to 10, with a median around 8.5.
**7. Privacy:**
* SFT (Gray): The box plot ranges from approximately 1 to 7, with a median around 4.
* beaver-7b-v3.0 (Light Purple): The box plot ranges from approximately 7 to 10, with a median around 9.
* SACPO (P) (Green): The box plot ranges from approximately 7 to 10, with a median around 9.
* RSA (P) (Red): The box plot ranges from approximately 7 to 10, with a median around 9.
**8. Social Bias:**
* SFT (Gray): The box plot ranges from approximately 1 to 8, with a median around 6.
* beaver-7b-v3.0 (Light Purple): The box plot ranges from approximately 6 to 9, with a median around 8.
* SACPO (P) (Green): The box plot ranges from approximately 6 to 9, with a median around 8.
* RSA (P) (Red): The box plot ranges from approximately 7 to 10, with a median around 9.
### Key Observations
* SFT consistently assigns lower harmlessness scores compared to the other models across all categories.
* beaver-7b-v3.0, SACPO (P), and RSA (P) generally assign higher harmlessness scores, with RSA (P) often having the highest median score.
* The "Crime" category shows a significant difference, with SFT assigning very low harmlessness scores, while the other models assign high scores.
* The distributions for beaver-7b-v3.0 and SACPO (P) are often very similar.
### Interpretation
The data suggests that the SFT model perceives the listed categories as potentially more harmful compared to the other models (beaver-7b-v3.0, SACPO (P), and RSA (P)). This is particularly evident in the "Crime" category, where SFT's scores are significantly lower. The other three models tend to agree more closely with each other, indicating a shared understanding or bias in their harmlessness assessments. The differences in scores could be attributed to the training data, architecture, or specific objectives of each model. The higher scores assigned by beaver-7b-v3.0, SACPO (P), and RSA (P) might reflect a tendency to downplay the potential harm associated with these categories, or a different interpretation of "harmlessness."