## Line Charts: Training Setup Performance Comparison
### Overview
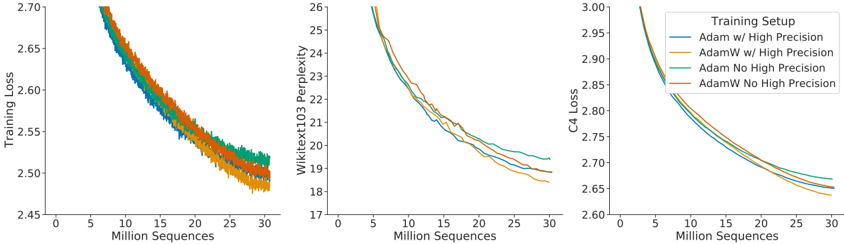
The image displays three horizontally arranged line charts comparing the performance of four different neural network training setups over the course of training. The charts track three distinct metrics: Training Loss, Wikitext103 Perplexity, and C4 Loss. All charts share the same x-axis, representing the number of training sequences processed in millions. The overall trend across all metrics and setups is a decreasing curve, indicating model improvement with more training data.
### Components/Axes
* **Chart Layout:** Three separate line charts arranged side-by-side.
* **Shared X-Axis:** All three charts have an x-axis labeled **"Million Sequences"**. The axis markers range from 0 to 30, with major ticks at 0, 5, 10, 15, 20, 25, and 30.
* **Y-Axes (Individual per chart):**
* **Left Chart:** Labeled **"Training Loss"**. Axis markers range from 2.45 to 2.70, with increments of 0.05.
* **Middle Chart:** Labeled **"Wikitext103 Perplexity"**. Axis markers range from 17 to 26, with increments of 1.
* **Right Chart:** Labeled **"C4 Loss"**. Axis markers range from 2.60 to 3.00, with increments of 0.05.
* **Legend:** Located in the top-right corner of the third (rightmost) chart. It is titled **"Training Setup"** and defines four colored lines:
* **Blue Line:** `Adam w/ High Precision`
* **Orange Line:** `AdamW w/ High Precision`
* **Green Line:** `Adam No High Precision`
* **Red Line:** `AdamW No High Precision`
### Detailed Analysis
**Chart 1: Training Loss**
* **Trend:** All four lines show a steep, concave-upward decreasing trend that begins to flatten after approximately 15-20 million sequences. The lines are tightly clustered, especially in the early stages.
* **Data Points (Approximate at 30M sequences):**
* `AdamW w/ High Precision` (Orange): ~2.48 (Lowest)
* `Adam w/ High Precision` (Blue): ~2.49
* `AdamW No High Precision` (Red): ~2.50
* `Adam No High Precision` (Green): ~2.51 (Highest)
**Chart 2: Wikitext103 Perplexity**
* **Trend:** Similar decreasing, concave-upward trend. The separation between the lines becomes more distinct compared to the Training Loss chart, especially after 10 million sequences.
* **Data Points (Approximate at 30M sequences):**
* `AdamW w/ High Precision` (Orange): ~18.5 (Lowest)
* `Adam w/ High Precision` (Blue): ~18.8
* `AdamW No High Precision` (Red): ~19.0
* `Adam No High Precision` (Green): ~19.5 (Highest)
**Chart 3: C4 Loss**
* **Trend:** Consistent decreasing, concave-upward trend. The lines are very close together, but a clear ordering is visible.
* **Data Points (Approximate at 30M sequences):**
* `AdamW w/ High Precision` (Orange): ~2.64 (Lowest)
* `Adam w/ High Precision` (Blue): ~2.65
* `AdamW No High Precision` (Red): ~2.66
* `Adam No High Precision` (Green): ~2.67 (Highest)
### Key Observations
1. **Consistent Performance Hierarchy:** Across all three metrics, the performance ranking of the setups is identical and stable throughout the training period shown. From best to worst: `AdamW w/ High Precision` > `Adam w/ High Precision` > `AdamW No High Precision` > `Adam No High Precision`.
2. **Impact of Optimizer:** The `AdamW` variants consistently outperform their `Adam` counterparts when the precision setting is held constant (e.g., Orange vs. Blue, Red vs. Green).
3. **Impact of Precision:** The `w/ High Precision` variants consistently outperform the `No High Precision` variants when the optimizer is held constant (e.g., Orange vs. Red, Blue vs. Green).
4. **Diminishing Returns:** All curves show a characteristic learning pattern with rapid initial improvement that gradually slows, suggesting diminishing returns from additional training sequences beyond ~20 million.
5. **Metric Sensitivity:** The separation between the best and worst performing setups is most pronounced in the Wikitext103 Perplexity metric and least pronounced in the C4 Loss metric.
### Interpretation
This set of charts provides a clear empirical comparison demonstrating the effects of two training hyperparameters: the choice of optimizer (Adam vs. AdamW) and the use of high-precision computation.
The data strongly suggests that **the combination of the AdamW optimizer and High Precision training yields the most effective model training**, as measured by lower loss on both the training set (Training Loss) and two distinct evaluation benchmarks (Wikitext103 and C4). The consistent ranking across different metrics indicates this is a robust finding, not an artifact of a single evaluation method.
The superiority of AdamW over Adam aligns with established deep learning practice, where AdamW's decoupled weight decay often leads to better generalization. The benefit of High Precision likely stems from reduced numerical error during gradient calculations and weight updates, allowing for more accurate optimization. The charts quantify the practical benefit of these choices, showing a meaningful reduction in final loss/perplexity. For a practitioner, this visualization argues for using AdamW with High Precision when computational resources allow, as it leads to a better-performing model for the same amount of training data.