## Bar Chart: Reflection Frequency Before and After GRPO
### Overview
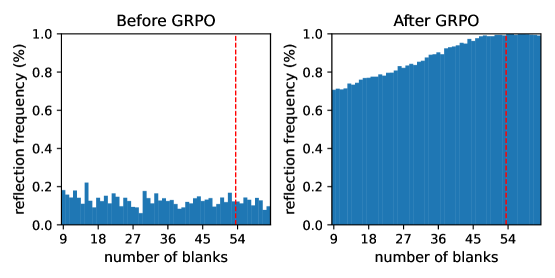
The image presents two bar charts side-by-side, comparing the reflection frequency as a function of the number of blanks "Before GRPO" and "After GRPO". The x-axis represents the number of blanks, ranging from approximately 9 to 54. The y-axis represents the reflection frequency in percentage, ranging from 0.0 to 1.0. A vertical dashed red line is present at x=54 in both charts.
### Components/Axes
* **Titles:**
* Left Chart: "Before GRPO"
* Right Chart: "After GRPO"
* **X-axis:** "number of blanks" with tick marks at approximately 9, 18, 27, 36, 45, and 54.
* **Y-axis:** "reflection frequency (%)" with tick marks at 0.0, 0.2, 0.4, 0.6, 0.8, and 1.0.
* **Bars:** Blue bars representing the reflection frequency for each number of blanks.
* **Vertical Line:** Dashed red line at x=54 in both charts.
### Detailed Analysis
**Left Chart: Before GRPO**
* **Trend:** The reflection frequency fluctuates randomly between 0.0 and 0.25 across the number of blanks. There is no clear trend.
* **Data Points:**
* At x=9, reflection frequency is approximately 0.15.
* At x=18, reflection frequency is approximately 0.22.
* At x=27, reflection frequency is approximately 0.12.
* At x=36, reflection frequency is approximately 0.15.
* At x=45, reflection frequency is approximately 0.10.
* At x=54, reflection frequency is approximately 0.12.
**Right Chart: After GRPO**
* **Trend:** The reflection frequency generally increases with the number of blanks.
* **Data Points:**
* At x=9, reflection frequency is approximately 0.72.
* At x=18, reflection frequency is approximately 0.75.
* At x=27, reflection frequency is approximately 0.80.
* At x=36, reflection frequency is approximately 0.85.
* At x=45, reflection frequency is approximately 0.90.
* At x=54, reflection frequency is approximately 0.98.
### Key Observations
* The reflection frequency is significantly higher "After GRPO" compared to "Before GRPO".
* "Before GRPO", the reflection frequency is relatively constant and low.
* "After GRPO", the reflection frequency increases with the number of blanks, approaching 1.0.
* The vertical red line at x=54 is present in both charts, possibly indicating a significant point or limit.
### Interpretation
The charts demonstrate the effect of GRPO (likely an optimization or processing step) on the reflection frequency as a function of the number of blanks. "Before GRPO", the reflection frequency is low and inconsistent, suggesting a less efficient or less controlled process. "After GRPO", the reflection frequency is significantly improved and shows a positive correlation with the number of blanks, indicating a more efficient and controlled process. The GRPO process appears to have significantly enhanced the reflection properties, especially as the number of blanks increases. The vertical line at x=54 might represent a design limit or a target value for the number of blanks.