## Heatmap Grid: Correlation Patterns Across 32 Neural Network Layers
### Overview
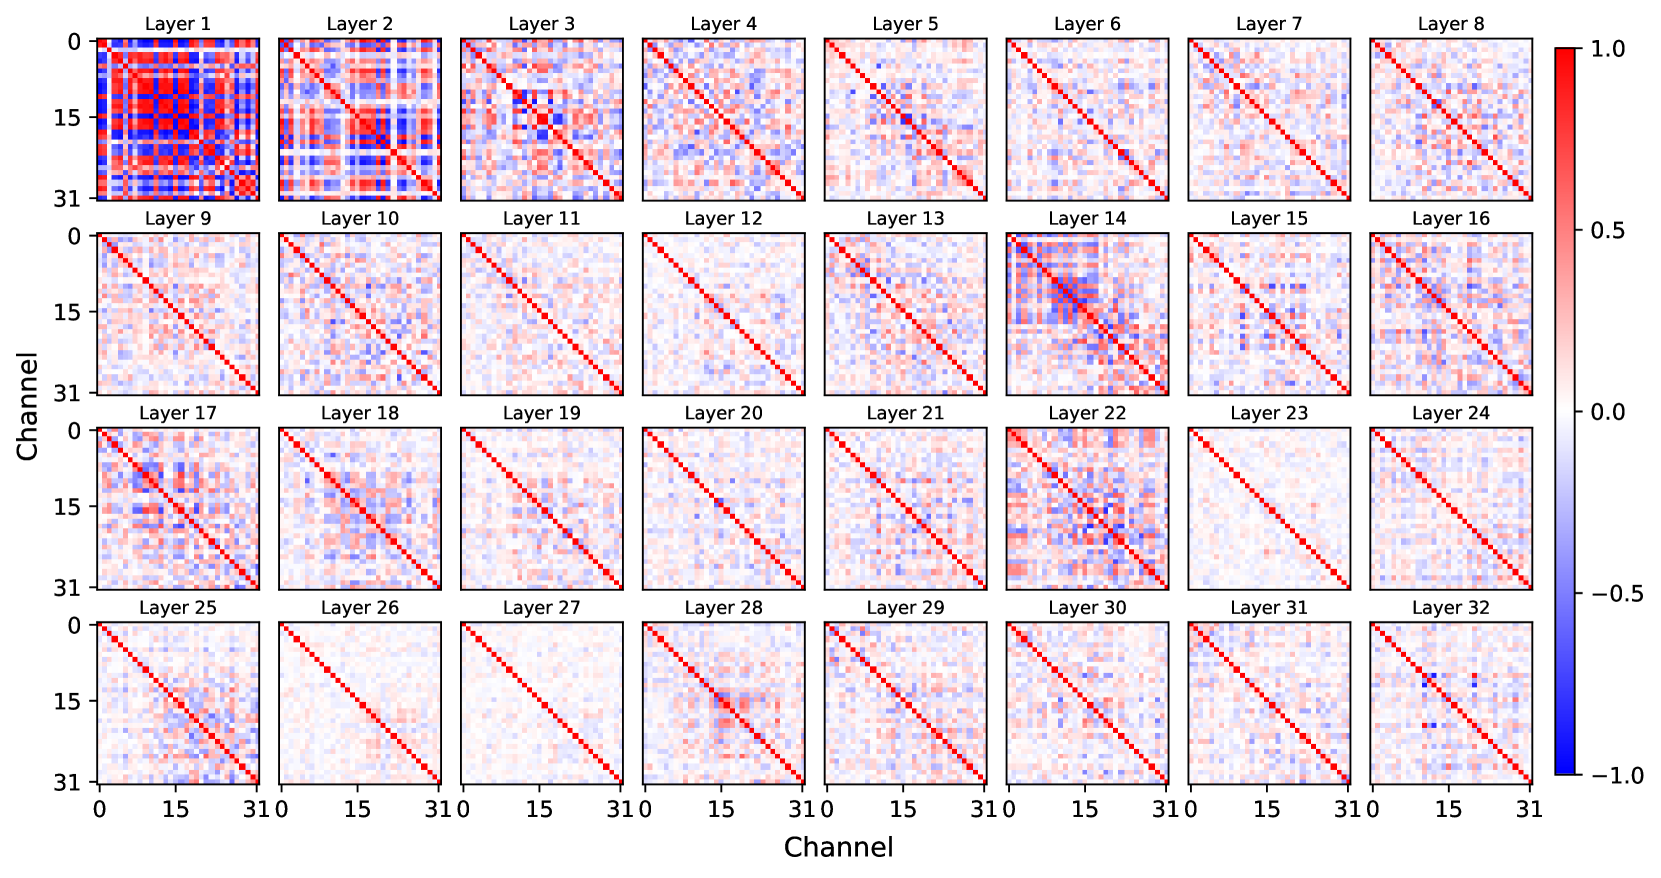
The image displays a 4x8 grid of 32 heatmaps, each representing correlation patterns within a specific layer of a neural network. Each heatmap is labeled "Layer X" (X=1-32) and visualizes channel-to-channel correlations using a red-blue color scale (-1.0 to 1.0). A consistent red diagonal line runs through all heatmaps, suggesting a structural pattern.
### Components/Axes
- **X/Y Axes**: Labeled "Channel" with numerical markers at 0, 15, and 31. Both axes range from 0 to 31.
- **Legend**: Vertical color bar on the right with values from -1.0 (blue) to 1.0 (red), indicating correlation strength.
- **Layer Labels**: Each heatmap is titled "Layer N" (N=1-32), arranged sequentially across the grid.
- **Red Diagonal**: A prominent red dashed line spans all heatmaps, positioned from top-left to bottom-right.
### Detailed Analysis
- **Layer 1-8**:
- High contrast between red (positive) and blue (negative) blocks.
- Layer 1 shows a checkerboard pattern with strong red/blue blocks.
- Layers 2-4 exhibit fragmented red/blue regions with diagonal dominance.
- Layers 5-8 display increasingly diffuse patterns but retain localized red/blue clusters.
- **Layer 9-16**:
- Gradual transition to more uniform white backgrounds with faint red/blue streaks.
- Layer 14 shows a dense red cluster near the center, suggesting localized high correlation.
- **Layer 17-24**:
- Predominantly white with sparse red/blue dots, indicating weak correlations.
- Layer 22 has a faint red diagonal band, hinting at residual structure.
- **Layer 25-32**:
- Return to moderate red/blue activity, particularly in Layer 32, which shows a concentrated red cluster near the bottom-right.
- Layer 31 exhibits a faint blue diagonal band, contrasting with the dominant red diagonal.
### Key Observations
1. **Early Layers (1-8)**: Strong, structured correlations with clear red/blue blocks.
2. **Middle Layers (9-16)**: Diminished correlation strength, with diffuse patterns.
3. **Late Layers (17-32)**: Resurgence of localized correlations, particularly in Layer 32.
4. **Red Diagonal Consistency**: Present in all layers, suggesting a baseline identity mapping or self-correlation mechanism.
5. **Color Scale**: Red (positive) dominates early/late layers; blue (negative) appears sporadically in middle layers.
### Interpretation
The heatmaps likely visualize **feature map correlations** in a deep learning model. Early layers (1-8) capture basic, spatially localized features with strong intra-channel correlations. Middle layers (9-16) represent abstracted features with weaker correlations, reflecting increased complexity. Late layers (17-32) show partial reactivation of structured patterns, possibly indicating hierarchical feature reuse or residual connections. The persistent red diagonal may represent **identity preservation** (e.g., input-output alignment) or **self-attention mechanisms**. Layer 32's concentrated red cluster suggests a dominant feature emerging in the final layer, potentially critical for task-specific outputs. The blue regions in middle layers might indicate antagonistic feature interactions, common in contrastive learning or adversarial training contexts.