## Time Series and Spike Raster Plot
### Overview
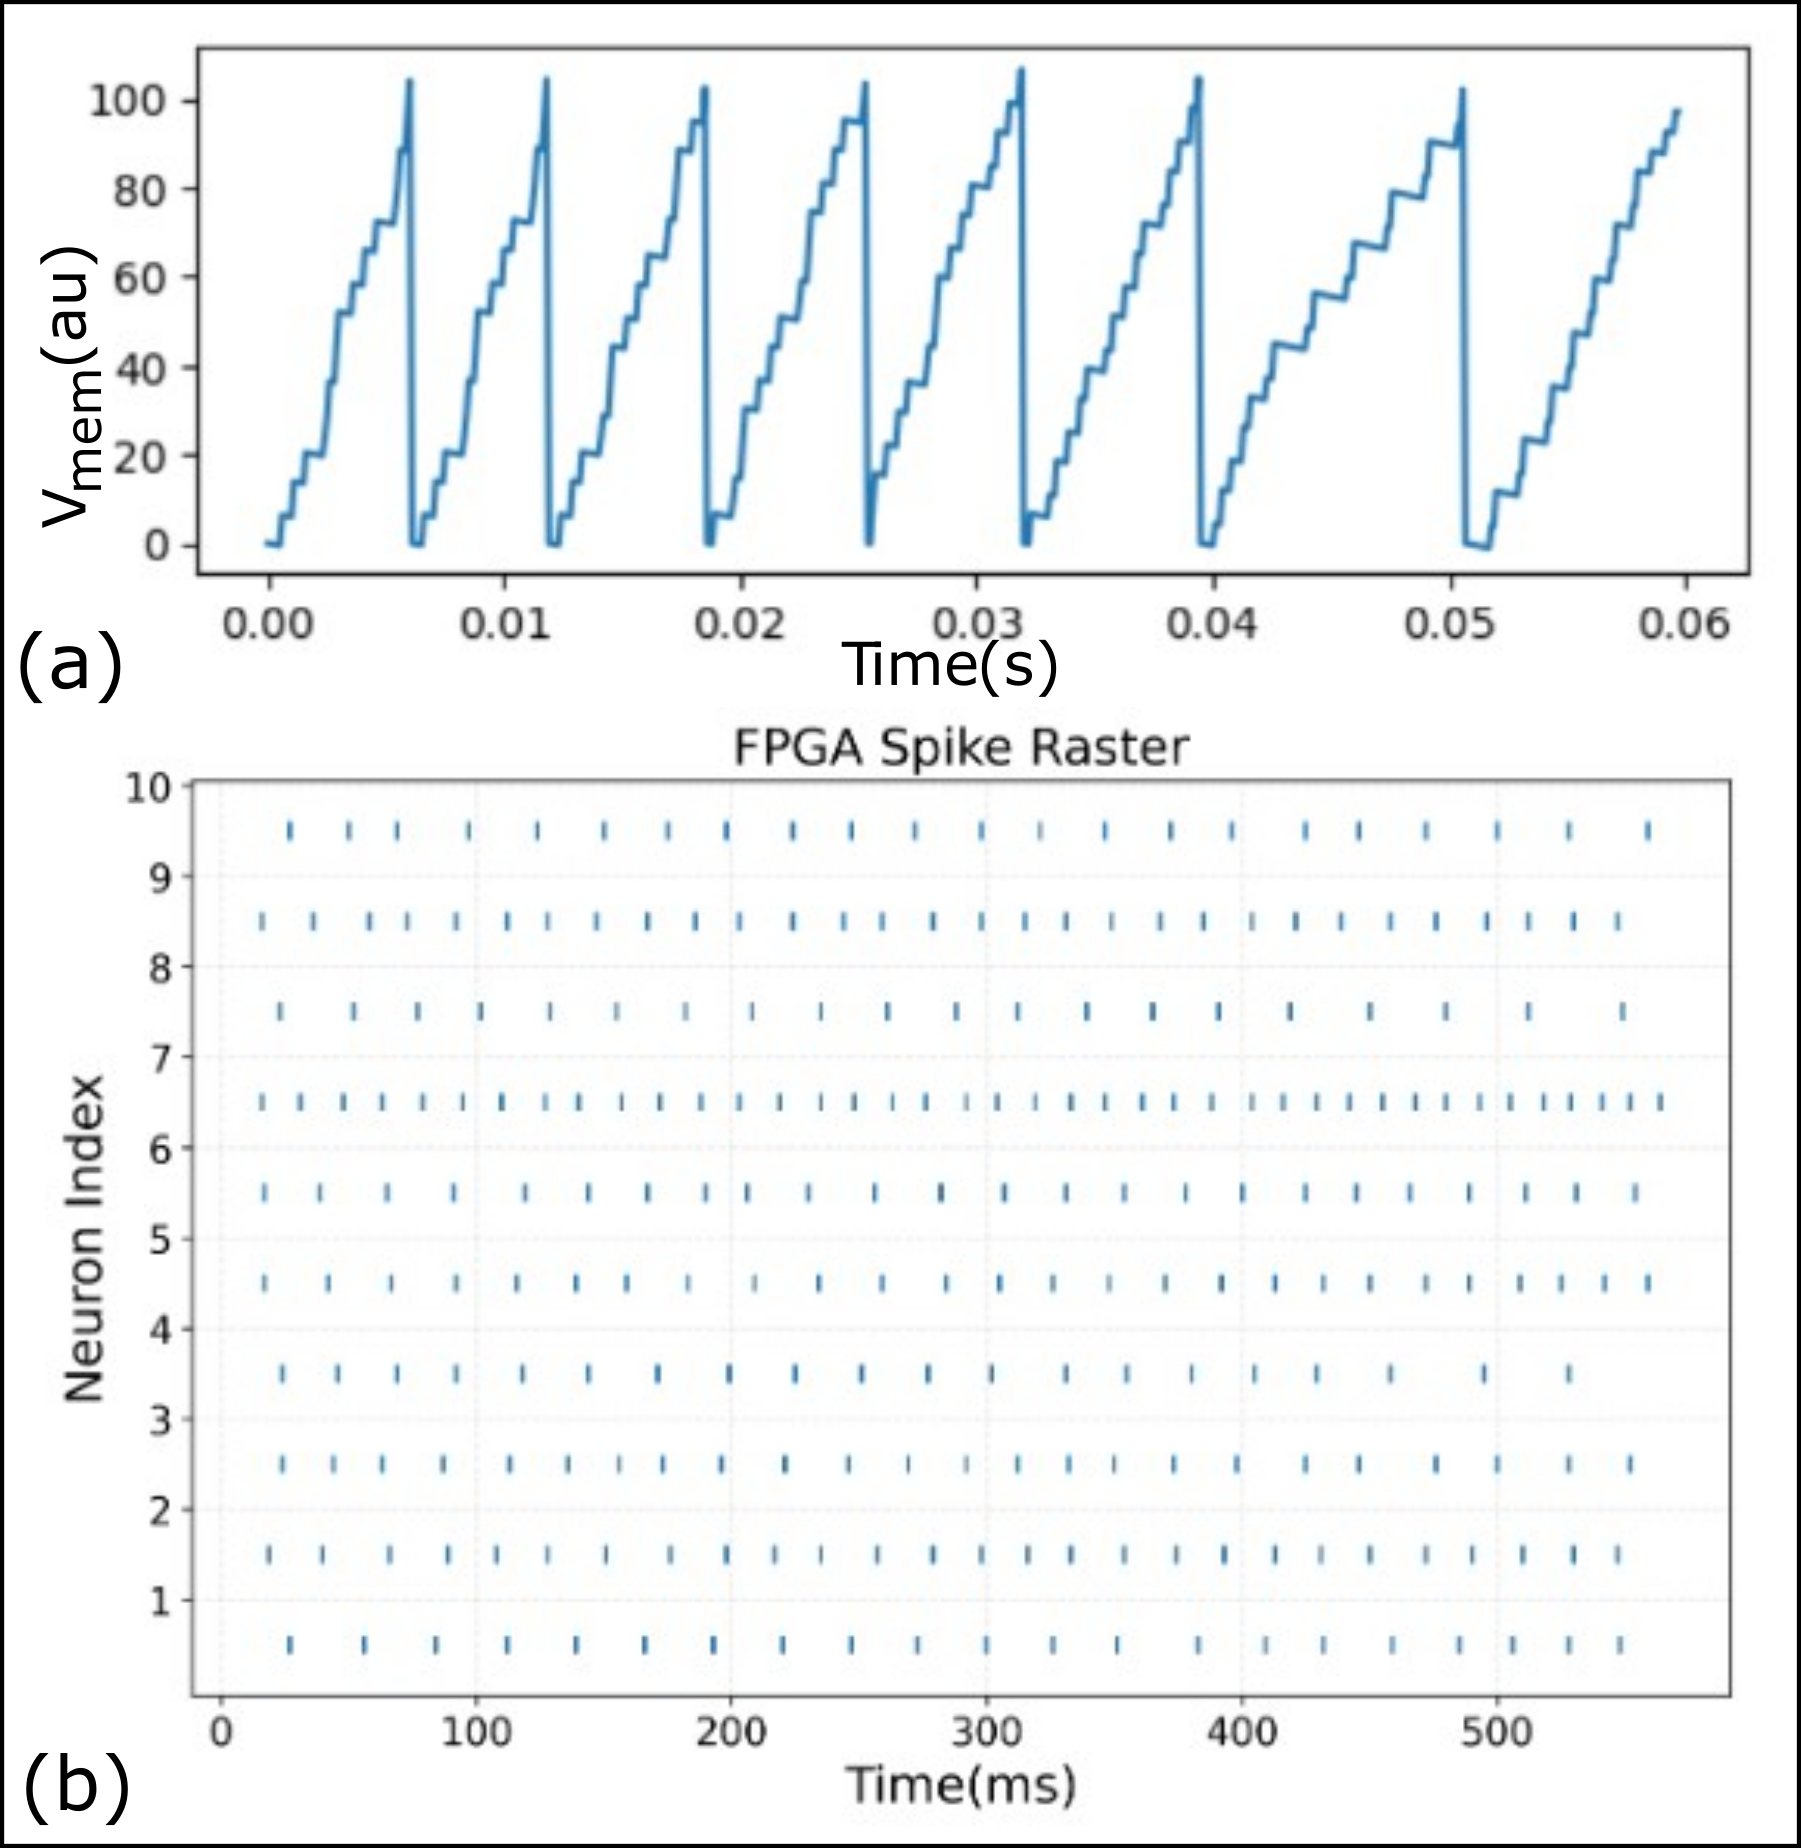
The image presents two plots. The top plot (a) shows a time series of a variable Vmem(au) over time, exhibiting a sawtooth pattern. The bottom plot (b) is a spike raster plot, displaying the spiking activity of 10 neurons over time.
### Components/Axes
**Plot (a): Time Series**
* **X-axis:** Time (s), ranging from 0.00 to 0.06, with tick marks at intervals of 0.01.
* **Y-axis:** Vmem(au), ranging from 0 to 100, with tick marks at intervals of 20.
* **Data:** A single blue line representing the time series data.
**Plot (b): Spike Raster**
* **Title:** FPGA Spike Raster
* **X-axis:** Time (ms), ranging from 0 to 600, with tick marks at intervals of 100.
* **Y-axis:** Neuron Index, ranging from 0 to 10, with tick marks at integer values.
* **Data:** Blue vertical lines representing spikes for each neuron.
### Detailed Analysis
**Plot (a): Time Series**
* The blue line shows a repeating sawtooth pattern. The voltage increases linearly with time, followed by a sharp drop to near zero.
* The period of the sawtooth wave is approximately 0.01 seconds.
* The voltage rises from approximately 0 to approximately 100 au before dropping.
**Plot (b): Spike Raster**
* Each row represents a neuron, indexed from 1 to 10.
* Each vertical blue line represents a spike event for that neuron at a specific time.
* The spiking activity appears to be relatively consistent across the neurons, with some variations in the timing and frequency of spikes.
* Neuron 4 appears to have a lower firing rate than the other neurons.
### Key Observations
* The time series plot (a) shows a periodic charging and discharging behavior.
* The spike raster plot (b) shows the timing of spikes for multiple neurons, revealing patterns of neural activity.
### Interpretation
The time series plot likely represents the membrane potential of a neuron, where the linear increase corresponds to charging and the sharp drop corresponds to a spike event. The spike raster plot shows the activity of a population of neurons, potentially driven by the charging and discharging behavior observed in the time series plot. The FPGA Spike Raster title suggests this is a simulation or hardware implementation of a neural network. The consistent spiking activity across neurons suggests a synchronized or coordinated behavior within the network. Neuron 4's lower firing rate could indicate a different role or connectivity within the network.