## Grid Heatmap: Color-Coded Numerical Data
### Overview
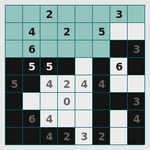
The image depicts an 8x8 grid of cells containing numerical values (0–6) with varying colors (light green, dark green, black, white, gray). No explicit axis labels, legends, or textual annotations are present. The grid appears to encode data through both numerical values and color intensity, though the exact mapping of colors to values is ambiguous without a legend.
### Components/Axes
- **Grid Structure**: 8 rows × 8 columns.
- **Cell Contents**: Each cell contains a single digit (0–6) in black, white, or gray text, with some cells filled with solid colors (light green, dark green, black) instead of text.
- **Color Usage**:
- Light green: Appears in the first two rows, primarily in cells with values 2, 3, 4, 5, 6.
- Dark green: Used in the third row (e.g., cells with values 5, 6) and fourth row (value 5).
- Black: Used in the fourth row (value 5) and sixth row (value 4).
- White/Gray: Empty cells (e.g., fifth row, third column with value 0) or cells with no visible text.
### Detailed Analysis
- **Row 1**: Light green cells with values 2, 3, 4, 5, 6. No black/gray text.
- **Row 2**: Light green cells with values 4, 2, 5. One dark green cell (value 5).
- **Row 3**: Dark green cells with values 5, 5, 6. One white cell (empty).
- **Row 4**: Dark green cell (value 5), black cell (value 6), and white cells.
- **Row 5**: Light green cells with values 4, 2, 4, 4. One white cell (value 0).
- **Row 6**: Light green cells with values 6, 4, 4. One black cell (value 3).
- **Row 7**: Light green cells with values 4, 2, 3, 2. One white cell.
- **Row 8**: Light green cells with values 4, 2, 3, 2. One black cell (value 4).
### Key Observations
1. **Color Distribution**: Light green dominates the top rows, while dark green and black appear in the middle and lower rows. White/gray cells are sparse but present (e.g., value 0 in row 5, column 3).
2. **Value Patterns**:
- High values (5–6) cluster in the top-middle and middle rows.
- Low values (0–2) appear in the bottom rows and scattered throughout.
- Repeated values (e.g., 4, 2, 5) suggest potential groupings or categories.
3. **Ambiguity**: No legend or axis labels prevent definitive interpretation of color meaning (e.g., whether light green = low values or a specific category).
### Interpretation
The grid likely represents a matrix of categorical or numerical data, with colors possibly encoding value ranges or groupings. For example:
- **Hypothesis 1**: Light green = values ≤ 4; dark green = 5–6; black = outliers (e.g., 6 in row 4, column 6).
- **Hypothesis 2**: Colors represent clusters (e.g., light green = group A, dark green = group B), with numbers indicating counts or identifiers.
The absence of a legend introduces uncertainty, but the spatial clustering of high values (5–6) in the upper-middle rows and low values (0–2) in the lower rows suggests a gradient or hierarchical structure. The repeated use of 4 and 2 in light green cells may indicate a dominant category or baseline value. The single 0 in row 5, column 3 stands out as an anomaly, potentially signifying missing data or a unique case.
This grid could model scenarios like survey responses, error rates, or resource allocation, where color and number interplay to highlight trends. Further analysis would require contextual metadata (e.g., legend, axis labels) to resolve ambiguities.