## Diagram: Causal Graph Representation
### Overview
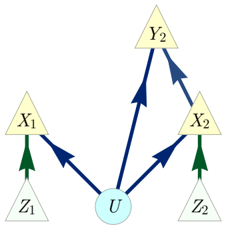
This image depicts a directed acyclic graph (DAG) representing causal relationships between several variables. The nodes are represented by geometric shapes, and the directed edges indicate the direction of influence or causality.
### Components/Axes
There are no explicit axes or scales in this diagram as it is a conceptual representation of relationships, not a quantitative plot.
The components are:
* **Nodes:**
* A central light blue circle labeled "U".
* Four light yellow triangles labeled "X₁", "Y₂", "X₂", and "Z₂".
* Two light yellow triangles labeled "Z₁".
* **Edges:**
* Dark blue arrows indicating directed relationships.
* Two dark green arrows indicating directed relationships.
### Detailed Analysis or Content Details
The diagram shows the following directed relationships:
* **From Z₁:** A dark green arrow points from "Z₁" to "X₁".
* **From Z₂:** A dark green arrow points from "Z₂" to "X₂".
* **From U:**
* A dark blue arrow points from "U" to "X₁".
* A dark blue arrow points from "U" to "X₂".
* A dark blue arrow points from "U" to "Y₂".
* **From X₁:** A dark blue arrow points from "X₁" to "Y₂".
* **From X₂:** A dark blue arrow points from "X₂" to "Y₂".
* **From Y₂:** A dark blue arrow points from "Y₂" to "X₂".
### Key Observations
* The variable "U" appears to be a common cause for "X₁", "X₂", and "Y₂".
* "Z₁" and "Z₂" are potential causes for "X₁" and "X₂" respectively, indicated by the green arrows.
* "Y₂" is influenced by "U", "X₁", and "X₂".
* There is a feedback loop indicated by the arrow from "Y₂" to "X₂". This suggests a potential cyclic dependency, which contradicts the typical definition of a Directed Acyclic Graph (DAG). However, in some causal inference contexts, such representations might be used to denote specific modeling assumptions or iterative processes.
### Interpretation
This diagram illustrates a causal model. The central node "U" is a foundational variable influencing several others. "X₁" and "X₂" are influenced by both "U" and their respective "Z" variables. "Y₂" is a downstream variable influenced by "U" and both "X₁" and "X₂". The presence of an arrow from "Y₂" back to "X₂" is noteworthy. If this is strictly a DAG, this arrow might represent a temporal relationship where "Y₂" influences a later state of "X₂", or it could indicate a model that allows for cycles, which would require different analytical techniques than standard DAGs.
The green arrows from "Z₁" and "Z₂" to "X₁" and "X₂" respectively could represent confounding variables or instrumental variables, depending on the specific context of the causal inference problem. The overall structure suggests a complex system where multiple factors interact to determine the outcomes of "X₁", "X₂", and "Y₂". The potential cycle between "Y₂" and "X₂" is the most significant feature requiring further clarification regarding the intended interpretation of the diagram.