## Chart: Accuracy vs. RL flops for different models
### Overview
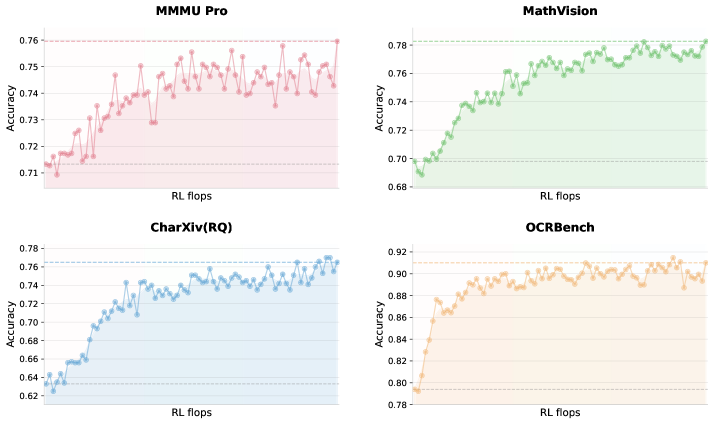
The image presents four line graphs, each displaying the accuracy of a different model (MMMU Pro, MathVision, CharXiv(RQ), and OCRBench) as a function of RL flops (Reinforcement Learning floating point operations). Each graph shows an initial increase in accuracy followed by a plateau or slight fluctuation.
### Components/Axes
* **X-axis (Horizontal):** "RL flops" (Reinforcement Learning floating point operations). The scale is not explicitly marked with numerical values.
* **Y-axis (Vertical):** "Accuracy". The scale varies slightly between the graphs but generally ranges from approximately 0.62 to 0.92.
* **MMMU Pro:** Accuracy ranges from 0.71 to 0.76.
* **MathVision:** Accuracy ranges from 0.68 to 0.78.
* **CharXiv(RQ):** Accuracy ranges from 0.62 to 0.78.
* **OCRBench:** Accuracy ranges from 0.78 to 0.92.
* **Titles:** Each graph has a title indicating the model name: "MMMU Pro", "MathVision", "CharXiv(RQ)", and "OCRBench".
* **Data Series:** Each graph contains a single data series represented by a line with circular markers.
* **MMMU Pro:** Pink line.
* **MathVision:** Green line.
* **CharXiv(RQ):** Blue line.
* **OCRBench:** Orange line.
* **Horizontal Dashed Lines:** Each graph has two horizontal dashed lines indicating the approximate minimum and maximum accuracy values.
### Detailed Analysis
**1. MMMU Pro (Top-Left)**
* **Color:** Pink
* **Trend:** The accuracy initially increases rapidly, then plateaus and fluctuates around 0.74 to 0.75.
* **Approximate Values:**
* Initial accuracy: ~0.715
* Peak accuracy: ~0.755
* Plateau accuracy: ~0.745
**2. MathVision (Top-Right)**
* **Color:** Green
* **Trend:** The accuracy increases sharply at first, then gradually increases and plateaus around 0.76 to 0.77.
* **Approximate Values:**
* Initial accuracy: ~0.69
* Peak accuracy: ~0.77
* Plateau accuracy: ~0.765
**3. CharXiv(RQ) (Bottom-Left)**
* **Color:** Blue
* **Trend:** The accuracy increases rapidly, then plateaus and fluctuates around 0.74 to 0.76.
* **Approximate Values:**
* Initial accuracy: ~0.63
* Peak accuracy: ~0.765
* Plateau accuracy: ~0.75
**4. OCRBench (Bottom-Right)**
* **Color:** Orange
* **Trend:** The accuracy increases rapidly, then plateaus and fluctuates around 0.90 to 0.91.
* **Approximate Values:**
* Initial accuracy: ~0.80
* Peak accuracy: ~0.91
* Plateau accuracy: ~0.905
### Key Observations
* All four models show a similar trend: a rapid initial increase in accuracy followed by a plateau.
* OCRBench achieves the highest overall accuracy, plateauing around 0.90-0.91.
* CharXiv(RQ) starts with the lowest initial accuracy but shows a significant improvement.
* The x-axis ("RL flops") is not numerically scaled, making it difficult to compare the training efficiency of the models.
### Interpretation
The graphs suggest that all four models benefit from reinforcement learning, as evidenced by the initial increase in accuracy with increasing RL flops. However, the models eventually reach a point of diminishing returns, where further training does not significantly improve accuracy. The differences in plateau levels indicate varying degrees of success for each model on its respective task. OCRBench appears to be the most successful, achieving a significantly higher accuracy than the other models. The lack of a numerical scale on the x-axis limits the ability to compare the training efficiency of the models.