## Line Graphs: Model Performance vs. RL Flops
### Overview
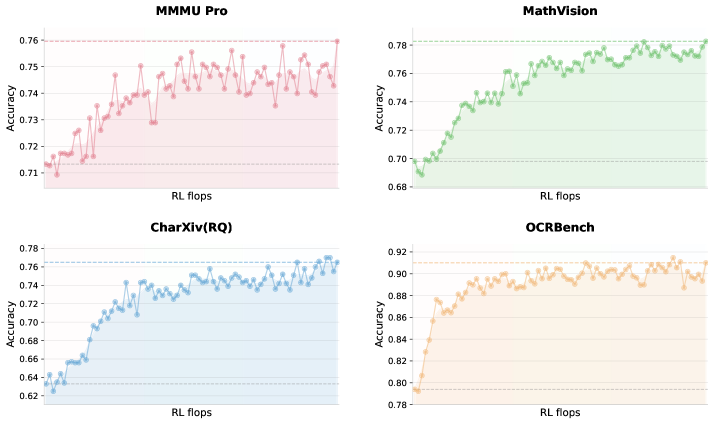
The image contains four line graphs comparing the accuracy of different models (MMMU Pro, MathVision, CharXiv(RQ), OCRBench) against reinforcement learning (RL) computational effort (measured in "RL flops"). Each graph shows a distinct trendline with shaded confidence intervals, plotted against a shared x-axis (RL flops) and y-axis (Accuracy).
---
### Components/Axes
- **X-Axis (Horizontal):**
- Label: "RL flops"
- Scale: 0 to ~100 (approximate, with ticks at 20, 40, 60, 80, 100).
- Position: Bottom of all graphs.
- **Y-Axis (Vertical):**
- Label: "Accuracy"
- Scale:
- Top-left (MMMU Pro): 0.71 to 0.76 (0.01 increments).
- Top-right (MathVision): 0.68 to 0.78 (0.02 increments).
- Bottom-left (CharXiv(RQ)): 0.62 to 0.78 (0.02 increments).
- Bottom-right (OCRBench): 0.78 to 0.92 (0.02 increments).
- Position: Left side of all graphs.
- **Legends:**
- Top-left: Pink line = "MMMU Pro".
- Top-right: Green line = "MathVision".
- Bottom-left: Blue line = "CharXiv(RQ)".
- Bottom-right: Orange line = "OCRBench".
- Position: Top of each graph.
- **Shaded Regions:**
- Light-colored bands (pink, green, blue, orange) under each line, likely representing confidence intervals or variability.
---
### Detailed Analysis
1. **MMMU Pro (Pink):**
- Starts at ~0.71 accuracy at 0 RL flops.
- Peaks at ~0.76 accuracy, with fluctuations (e.g., dips to ~0.73 at ~40 RL flops).
- Final accuracy stabilizes near 0.76 after ~80 RL flops.
2. **MathVision (Green):**
- Begins at ~0.68 accuracy, rising steadily to ~0.78.
- Sharp increase between 20–40 RL flops, then gradual plateau.
3. **CharXiv(RQ) (Blue):**
- Starts at ~0.62 accuracy, climbing to ~0.78.
- Steeper growth in early stages (0–40 RL flops), then stabilizes.
4. **OCRBench (Orange):**
- Begins at ~0.78 accuracy, rising to ~0.92.
- Consistent upward trend with minimal fluctuations.
---
### Key Observations
- **Accuracy vs. RL Flops:** All models show improved accuracy with increased RL flops, but rates of improvement vary.
- **OCRBench Dominance:** Achieves the highest final accuracy (~0.92) with the least computational effort (~80 RL flops).
- **MMMU Pro Volatility:** Exhibits the most fluctuation, suggesting instability in training or evaluation.
- **CharXiv(RQ) Efficiency:** Rapid early gains but plateaus earlier than others.
---
### Interpretation
The data suggests that **OCRBench** is the most efficient model, achieving high accuracy with moderate RL flops. **MathVision** and **CharXiv(RQ)** demonstrate strong scalability, with CharXiv(RQ) showing rapid early improvements. **MMMU Pro**’s volatility may indicate challenges in training stability or evaluation methodology. The shaded regions imply that confidence intervals widen for some models (e.g., MMMU Pro), highlighting uncertainty in performance estimates. These trends underscore the trade-off between computational cost and model performance, with OCRBench offering the optimal balance.