## Diagram: System Architecture for Action Recognition
### Overview
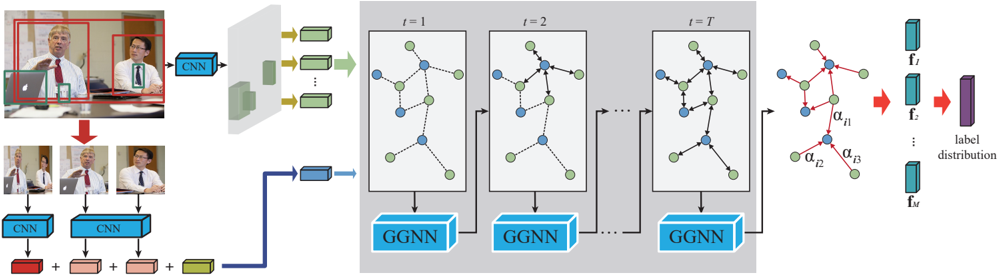
The image presents a system architecture for action recognition, likely in video. It illustrates the process from initial video frames to final label distribution, involving CNNs, graph neural networks (GGNNs), and feature extraction.
### Components/Axes
* **Image Frames (Left):** Shows a sequence of video frames. The first frame has bounding boxes around detected objects/people. Subsequent frames are processed individually.
* **CNN Blocks:** Convolutional Neural Networks used for feature extraction from individual frames and detected objects.
* **Feature Vectors:** Represented as colored blocks (red, pink, green), resulting from CNN processing.
* **Graph Neural Network (GNN) Stages (Center):** Three stages labeled t=1, t=2, and t=T, representing time steps. Each stage contains a graph with nodes (blue and green) and edges (dashed and solid lines).
* **GGNN Blocks:** Graph Neural Networks that process the graph representations at each time step.
* **Attention Mechanism (Right):** A graph with nodes and edges, with attention coefficients (alpha values) on the edges.
* **Feature Vectors (Right):** A series of feature vectors f1, f2, ..., fm.
* **Label Distribution (Right):** The final output, representing the probability distribution over possible action labels.
### Detailed Analysis
1. **Initial Frame Processing (Left):**
* The initial video frame shows two people and a laptop, each enclosed in bounding boxes (red and green).
* These bounding boxes are fed into a CNN.
* Subsequent frames are also processed by CNNs.
* The outputs of these CNNs are feature vectors, represented by colored blocks.
* These feature vectors are combined (addition operation) to form a single feature vector.
2. **Graph Construction and GGNN Stages (Center):**
* The combined feature vector is used to construct a graph.
* The graph evolves over time, represented by stages t=1, t=2, and t=T.
* Each node in the graph is either blue or green.
* Edges between nodes are either dashed or solid lines, possibly indicating different types of relationships.
* Each graph is processed by a GGNN.
3. **Attention and Label Prediction (Right):**
* The output of the final GGNN stage (t=T) is used to compute attention coefficients (alpha values) on the edges of a graph.
* These attention-weighted features are used to generate a series of feature vectors f1, f2, ..., fm.
* These feature vectors are then used to predict the final label distribution.
### Key Observations
* The system uses a combination of CNNs and GGNNs to recognize actions in video.
* The graph representation allows the system to model relationships between different objects and people in the scene.
* The attention mechanism allows the system to focus on the most relevant parts of the graph when making predictions.
* The system processes video frames sequentially, updating the graph representation at each time step.
### Interpretation
The diagram illustrates a sophisticated approach to action recognition that leverages both spatial and temporal information. The CNNs extract features from individual frames, while the GGNNs model the relationships between these features over time. The attention mechanism further refines the model by focusing on the most important relationships. This architecture is likely designed to handle complex actions that involve multiple objects and people interacting with each other. The use of graph neural networks suggests that the relationships between entities in the scene are crucial for accurate action recognition. The temporal aspect, represented by the sequence of graphs at t=1, t=2, ..., t=T, indicates that the system considers the evolution of these relationships over time.