\n
## Diagram: Group-aware Graph Neural Network (G-GNN) Architecture
### Overview
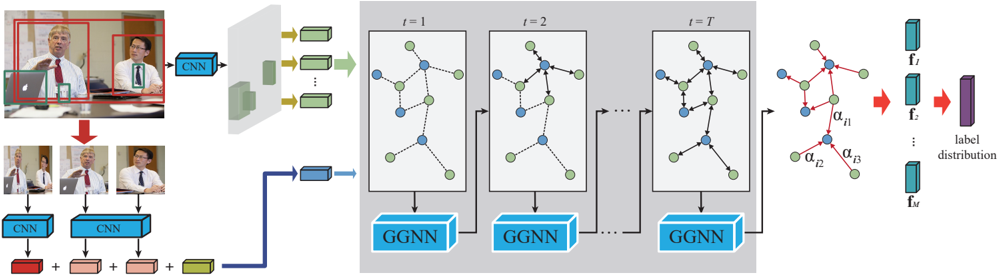
The image depicts the architecture of a Group-aware Graph Neural Network (G-GNN) for group-level human activity recognition. The diagram illustrates how video frames are processed through Convolutional Neural Networks (CNNs) to extract features, which are then fed into a series of Graph Neural Networks (GGNNs) to model group interactions over time. Finally, the outputs of the GGNNs are used to predict a label distribution.
### Components/Axes
The diagram can be divided into three main sections:
1. **Input & Feature Extraction:** Video frames are processed by CNNs.
2. **Temporal Graph Modeling:** A series of GGNNs process the extracted features over time.
3. **Output & Prediction:** The final GGNN output is used to generate a label distribution.
Key components include:
* **CNN:** Convolutional Neural Network.
* **GGNN:** Group-aware Graph Neural Network.
* **Nodes:** Represent individuals within a group.
* **Edges:** Represent relationships or interactions between individuals.
* **t = 1, t = 2, ..., t = T:** Indicates time steps.
* **f<sub>i</sub>:** Feature vector for individual i.
* **f<sub>T</sub>:** Final feature vector.
* **α<sub>i1</sub>, α<sub>i2</sub>, α<sub>i3</sub>:** Attention weights.
* **Label Distribution:** The final output, representing the probability of different activity labels.
### Detailed Analysis or Content Details
The diagram shows the following flow:
1. **Input:** The left side shows two sets of video frames. The top set shows a single person in a red frame, and the bottom set shows multiple people.
2. **CNN Feature Extraction:** Each set of video frames is fed into a CNN. The CNN outputs a feature vector (represented by green rectangles with arrows) for each person.
3. **Graph Construction:** The feature vectors are used to construct a graph. Nodes represent individuals, and edges represent relationships between them. The graphs are shown within gray boxes labeled "t = 1", "t = 2", and "t = T", indicating different time steps.
4. **GGNN Processing:** Each graph is processed by a GGNN. The GGNN updates the node features based on the graph structure and the features of neighboring nodes.
5. **Temporal Modeling:** The GGNNs are applied sequentially over time (from t=1 to t=T), allowing the model to capture temporal dependencies in group interactions.
6. **Attention Mechanism:** In the final time step (t=T), attention weights (α<sub>i1</sub>, α<sub>i2</sub>, α<sub>i3</sub>) are applied to the node features. These weights indicate the importance of different nodes in the graph. The red edges in the final graph indicate the attention weights.
7. **Output:** The output of the final GGNN (f<sub>T</sub>) is used to generate a label distribution. The label distribution is represented by a vertical stack of purple rectangles.
The diagram does not provide specific numerical values for the feature vectors, attention weights, or label distribution. It is a conceptual illustration of the G-GNN architecture.
### Key Observations
* The architecture explicitly models group interactions using graph neural networks.
* The temporal dimension is handled by applying the GGNN sequentially over time.
* An attention mechanism is used to focus on the most relevant individuals in the group.
* The input can be a single person or a group of people.
### Interpretation
The G-GNN architecture is designed to address the challenges of group-level human activity recognition. By representing the group as a graph, the model can capture the complex interactions between individuals. The temporal modeling component allows the model to understand how these interactions evolve over time. The attention mechanism helps the model to focus on the most important individuals in the group, improving the accuracy of the activity recognition.
The diagram suggests that the model is capable of handling variable-sized groups, as the number of nodes in the graph can change over time. The use of CNNs for feature extraction allows the model to leverage the power of deep learning for visual feature representation. The overall architecture is a sophisticated approach to group-level activity recognition that combines the strengths of graph neural networks, convolutional neural networks, and attention mechanisms. The diagram is a high-level overview and does not provide details on the specific implementation of the GGNN or the attention mechanism.