## Diagram: Spatio-Temporal Graph Neural Network Architecture for Group Activity Recognition
### Overview
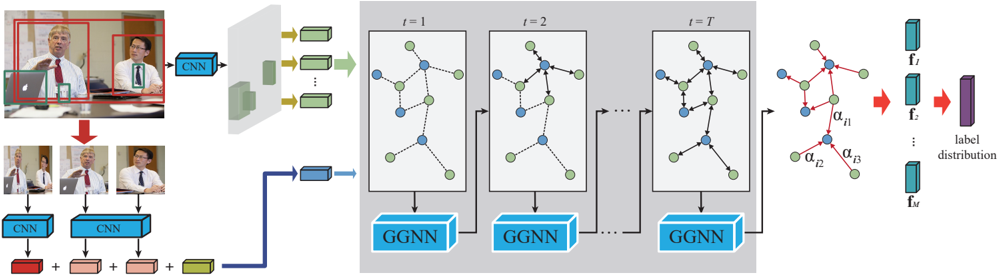
The image is a technical architecture diagram illustrating a deep learning model designed for group activity recognition from video. The model processes both spatial (appearance) and temporal (interaction) information using Convolutional Neural Networks (CNNs) and Gated Graph Neural Networks (GGNNs). The flow moves from left to right, starting with video input and ending with a label distribution prediction.
### Components/Axes
The diagram is segmented into three primary regions:
1. **Input & Feature Extraction Region (Left):**
* **Top-left:** A video frame showing a meeting scene. Two individuals are highlighted with red bounding boxes. A laptop is also visible.
* **Text/Labels:** None directly on the frame.
* **Flow:** The entire frame feeds into a blue block labeled **"CNN"**. The output of this CNN is a set of feature maps (green rectangles).
* **Bottom-left:** Cropped images of the two individuals from the bounding boxes. Each cropped image feeds into its own blue **"CNN"** block.
* **Text/Labels:** The cropped images are labeled with small red numbers: **"1"** and **"2"**.
* **Flow:** The outputs of the individual CNNs are combined (indicated by **"+"** signs) with the global features from the top CNN. This combined feature set is represented by a blue rectangle.
2. **Temporal Graph Processing Region (Center):**
* **Structure:** A large grey box containing a sequence of graph structures evolving over time.
* **Text/Labels:** Time steps are labeled at the top: **"t = 1"**, **"t = 2"**, **"t = T"**.
* **Graph Components:** Each time step shows a graph with nodes (blue and green circles) connected by edges (dashed lines). The graph structure appears to change slightly between steps.
* **Processing Block:** Below each graph is a blue block labeled **"GGNN"** (Gated Graph Neural Network). Arrows indicate the graph state and features are passed from one GGNN to the next, modeling temporal evolution.
* **Flow:** The combined feature vector from the left region initializes the graph at `t=1`. The sequence of GGNNs processes the graph over `T` time steps.
3. **Output & Prediction Region (Right):**
* **Structure:** The final graph state (after `t=T`) is shown. Its nodes are connected by red edges.
* **Text/Labels:** The red edges are labeled with attention weights: **"α_j1"**, **"α_j2"**, **"α_j3"**.
* **Flow:** The final graph features are processed to produce a set of feature vectors: **"f_1"**, **"f_2"**, **"f_M"** (represented as blue vertical rectangles).
* **Final Output:** These feature vectors are aggregated (indicated by a red arrow) into a single purple vertical rectangle labeled **"label distribution"**.
### Detailed Analysis
* **Input Processing:** The model uses a two-stream approach:
1. A **global stream** (top CNN) processes the entire scene context.
2. An **individual stream** (bottom CNNs) processes cropped images of each person (labeled 1 and 2).
These streams are fused (via addition) before being fed into the graph model.
* **Graph Structure:** The nodes in the graph likely represent entities (e.g., individuals, objects). The blue and green colors may differentiate node types (e.g., people vs. objects, or active vs. passive participants). The dashed edges represent spatial or interaction relationships.
* **Temporal Modeling:** The GGNN blocks process the graph sequentially from `t=1` to `t=T`, allowing the model to capture how interactions and states evolve over the video clip.
* **Attention Mechanism:** The final graph uses attention weights (`α_j1`, `α_j2`, `α_j3`) on its edges, suggesting the model learns to weigh the importance of different relationships for the final prediction.
* **Output:** The model outputs a **"label distribution"**, which is a probability distribution over possible group activity classes (e.g., "discussion", "presentation", "arguing").
### Key Observations
1. **Hybrid Architecture:** The model is a hybrid of CNNs (for visual feature extraction) and GGNNs (for relational and temporal reasoning).
2. **Multi-scale Input:** It explicitly processes both the full scene and individual actors, suggesting it leverages both context and personal cues.
3. **Dynamic Graphs:** The graph structure is not static; it evolves over time (`t=1` to `t=T`), which is crucial for modeling dynamic group interactions.
4. **Interpretability Component:** The attention weights (`α_j`) in the final stage provide a degree of interpretability, showing which relationships were most influential in determining the activity label.
### Interpretation
This diagram represents a sophisticated approach to understanding complex social scenes in videos. The core innovation lies in framing group activity recognition as a **spatio-temporal graph reasoning problem**.
* **What it demonstrates:** The model first identifies "who" and "what" is in the scene (via CNNs), then models "how they are connected" and "how those connections change" (via the evolving GGNN). The final attention mechanism highlights the most critical interactions for classification.
* **Relationship between elements:** The left side (CNNs) answers *"What do we see?"*. The center (GGNNs) answers *"How are the entities interacting over time?"*. The right side (label distribution) answers *"What activity does this pattern of interaction represent?"*.
* **Underlying hypothesis:** The architecture embodies the hypothesis that group activities are defined not just by the presence of individuals, but by the **structure and evolution of their interactions**. The use of a graph is a direct mathematical representation of this social structure.
* **Potential application:** Such a model would be valuable in surveillance, human-robot interaction, sports analysis, and video understanding, where interpreting collective behavior is key. The explicit modeling of relationships makes it more robust than methods that only consider individual actions in isolation.