## Histogram: Model Confidence Distribution
### Overview
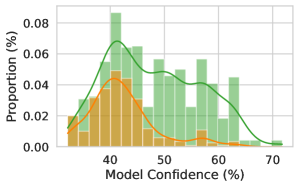
The image is a histogram showing the distribution of model confidence, measured in percentage, for two different categories. The y-axis represents the proportion (in percentage), and the x-axis represents the model confidence (in percentage). Two distinct distributions are shown, one in green and one in orange.
### Components/Axes
* **X-axis:** Model Confidence (%), ranging from approximately 35% to 70%.
* **Y-axis:** Proportion (%), ranging from 0.00% to 0.08%.
* **Data Series:**
* Green: Represents one category of model confidence.
* Orange: Represents another category of model confidence.
### Detailed Analysis
* **Green Distribution:**
* Trend: The green distribution appears to be roughly normal, with a peak around 45-55%.
* Data Points:
* Proportion at 35%: Approximately 0.01%.
* Peak Proportion: Approximately 0.06% at 45-55%.
* Proportion at 70%: Approximately 0.00%.
* **Orange Distribution:**
* Trend: The orange distribution is skewed to the right, with a peak around 40%.
* Data Points:
* Proportion at 35%: Approximately 0.01%.
* Peak Proportion: Approximately 0.04% at 40%.
* Proportion at 60%: Approximately 0.01%.
### Key Observations
* The green distribution has a higher overall proportion of model confidences in the 50-60% range compared to the orange distribution.
* The orange distribution is concentrated around lower model confidence values (around 40%).
* Both distributions have very low proportions at the extreme ends of the model confidence range (35% and 70%).
### Interpretation
The histogram suggests that the model has different levels of confidence for the two categories being analyzed. The green category tends to have higher confidence scores, while the orange category tends to have lower confidence scores. This could indicate that the model is better at predicting the green category or that the green category is inherently easier to predict. The difference in distributions could be due to various factors, such as differences in the training data or the inherent characteristics of the categories themselves. Further investigation would be needed to determine the underlying reasons for these differences.