## ROC Curve: Receiver Operating Characteristic Curves
### Overview
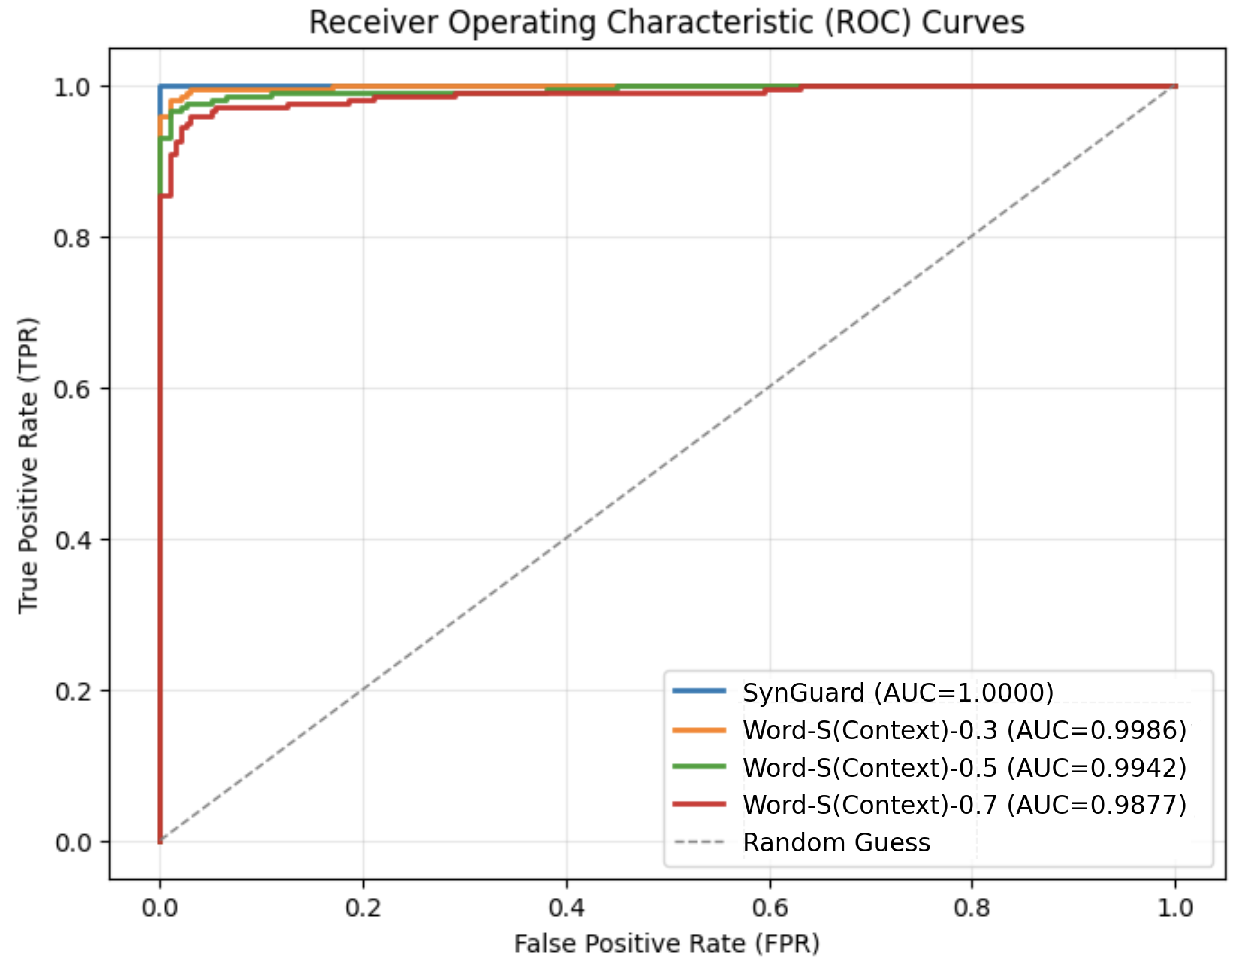
The image is a Receiver Operating Characteristic (ROC) curve comparing the performance of different models: SynGuard, Word-S(Context)-0.3, Word-S(Context)-0.5, and Word-S(Context)-0.7. The plot shows the True Positive Rate (TPR) against the False Positive Rate (FPR) for each model, along with a "Random Guess" baseline. The Area Under the Curve (AUC) is provided for each model in the legend.
### Components/Axes
* **Title:** Receiver Operating Characteristic (ROC) Curves
* **X-axis:** False Positive Rate (FPR), ranging from 0.0 to 1.0 in increments of 0.2.
* **Y-axis:** True Positive Rate (TPR), ranging from 0.0 to 1.0 in increments of 0.2.
* **Legend:** Located in the bottom-right corner, it identifies each model and its corresponding AUC score:
* SynGuard (AUC=1.0000) - Blue line
* Word-S(Context)-0.3 (AUC=0.9986) - Orange line
* Word-S(Context)-0.5 (AUC=0.9942) - Green line
* Word-S(Context)-0.7 (AUC=0.9877) - Red line
* Random Guess - Dashed gray line
### Detailed Analysis
* **SynGuard (Blue):** The blue line representing SynGuard rises sharply to a TPR of 1.0 at a very low FPR (approximately 0.0). It maintains a TPR of 1.0 across all FPR values.
* AUC = 1.0000
* **Word-S(Context)-0.3 (Orange):** The orange line representing Word-S(Context)-0.3 rises sharply, reaching a TPR of approximately 0.95 at a low FPR (approximately 0.02). It then plateaus near a TPR of 1.0.
* AUC = 0.9986
* **Word-S(Context)-0.5 (Green):** The green line representing Word-S(Context)-0.5 rises sharply, reaching a TPR of approximately 0.90 at a low FPR (approximately 0.02). It then plateaus near a TPR of 1.0.
* AUC = 0.9942
* **Word-S(Context)-0.7 (Red):** The red line representing Word-S(Context)-0.7 rises sharply, reaching a TPR of approximately 0.85 at a low FPR (approximately 0.02). It then plateaus near a TPR of 1.0.
* AUC = 0.9877
* **Random Guess (Dashed Gray):** The dashed gray line represents a random guess, showing a linear relationship between FPR and TPR. It starts at (0.0, 0.0) and ends at (1.0, 1.0).
### Key Observations
* SynGuard performs perfectly, achieving a TPR of 1.0 at a very low FPR, indicated by an AUC of 1.0000.
* The Word-S(Context) models perform very well, with AUC scores close to 1.0. As the context value increases from 0.3 to 0.7, the AUC score decreases slightly, indicating a minor reduction in performance.
* All models significantly outperform the "Random Guess" baseline.
### Interpretation
The ROC curves demonstrate the effectiveness of the SynGuard and Word-S(Context) models in distinguishing between positive and negative cases. SynGuard achieves perfect classification, while the Word-S(Context) models also perform exceptionally well. The slight decrease in performance as the context value increases from 0.3 to 0.7 suggests that there might be an optimal context value for the Word-S(Context) model. The fact that all models outperform the random guess baseline indicates that they have learned meaningful patterns from the data.