## Receiver Operating Characteristic (ROC) Curves
### Overview
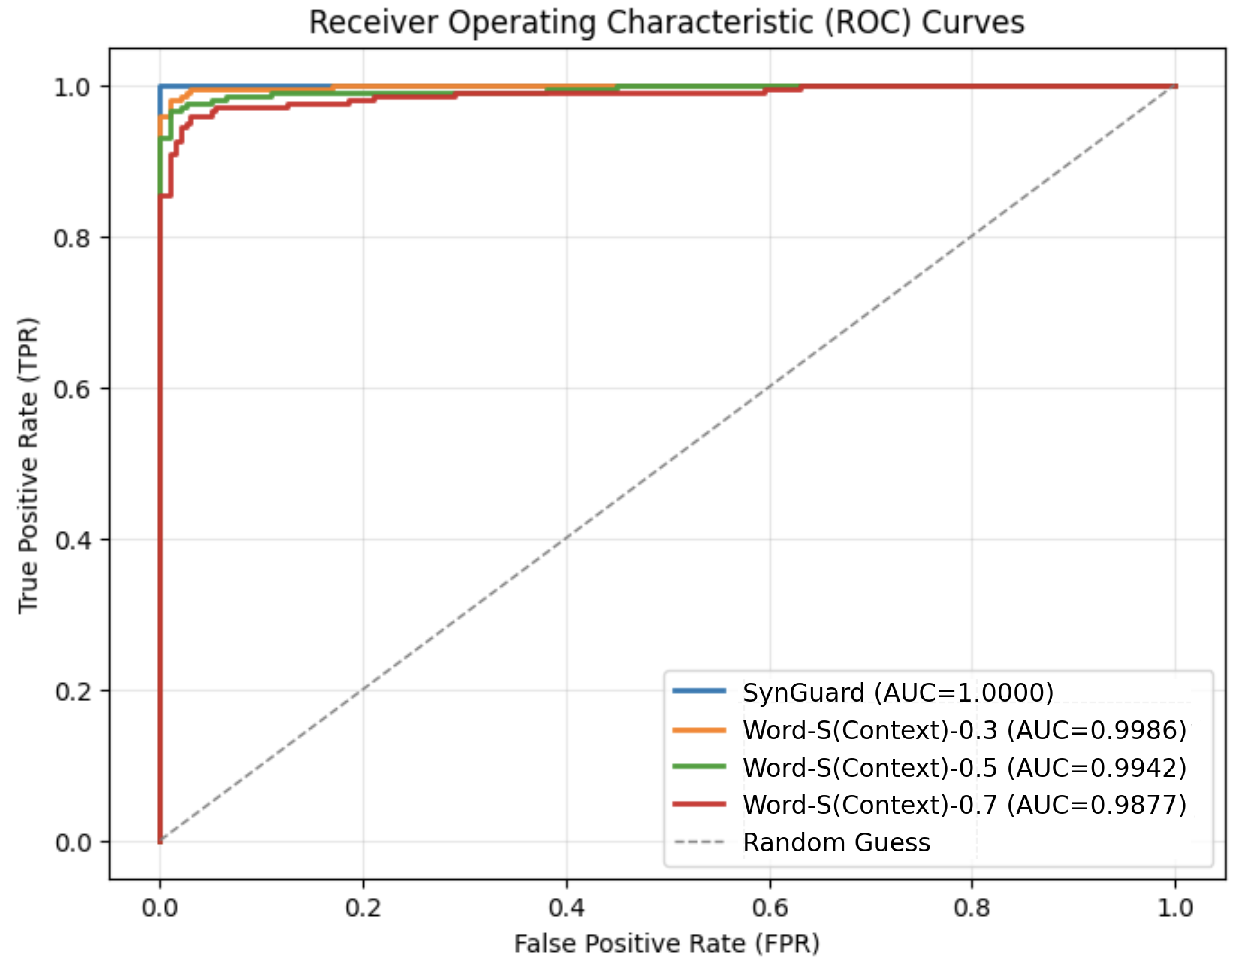
The image displays a Receiver Operating Characteristic (ROC) curve comparing the performance of multiple classification models. The chart plots **True Positive Rate (TPR)** against **False Positive Rate (FPR)** for different algorithms, with a reference line for random guessing. All models show high performance, with SynGuard achieving near-perfect results.
---
### Components/Axes
- **X-axis**: False Positive Rate (FPR) ranging from 0.0 to 1.0 in increments of 0.2.
- **Y-axis**: True Positive Rate (TPR) ranging from 0.0 to 1.0 in increments of 0.2.
- **Legend**: Located in the bottom-right corner, listing:
- **SynGuard** (AUC = 1.0000) – Blue line.
- **Word-S(Context)-0.3** (AUC = 0.9986) – Orange line.
- **Word-S(Context)-0.5** (AUC = 0.9942) – Green line.
- **Word-S(Context)-0.7** (AUC = 0.9877) – Red line.
- **Random Guess** – Dashed gray diagonal line from (0,0) to (1,1).
---
### Detailed Analysis
1. **SynGuard (Blue Line)**:
- Starts at (FPR=0.0, TPR=1.0) and remains perfectly flat at TPR=1.0 across all FPR values.
- AUC = 1.0000, indicating perfect classification with no trade-off between TPR and FPR.
2. **Word-S(Context)-0.3 (Orange Line)**:
- Begins at (FPR=0.0, TPR≈0.95) and rises sharply to TPR=1.0 by FPR=0.1.
- Maintains TPR=1.0 for FPR > 0.1, with AUC = 0.9986.
3. **Word-S(Context)-0.5 (Green Line)**:
- Starts at (FPR=0.0, TPR≈0.9) and rises to TPR=1.0 by FPR=0.15.
- Remains flat at TPR=1.0 for FPR > 0.15, with AUC = 0.9942.
4. **Word-S(Context)-0.7 (Red Line)**:
- Begins at (FPR=0.0, TPR≈0.85) and reaches TPR=1.0 by FPR=0.2.
- Stays flat at TPR=1.0 for FPR > 0.2, with AUC = 0.9877.
5. **Random Guess (Dashed Gray Line)**:
- Diagonal line from (0,0) to (1,1), representing a baseline performance with no discriminative power.
---
### Key Observations
- **SynGuard** outperforms all other models, achieving perfect TPR at FPR=0.0.
- **Word-S(Context)** models show diminishing performance as the context parameter increases (from -0.3 to -0.7), reflected in lower AUC values.
- All models significantly exceed the random guess line, confirming their utility in classification tasks.
- The steepest rise in TPR occurs for SynGuard and Word-S(Context)-0.3, indicating rapid improvement in sensitivity.
---
### Interpretation
The chart demonstrates that **SynGuard** is the optimal classifier for this dataset, with no trade-off between sensitivity and false alarms. The **Word-S(Context)** models exhibit near-optimal performance but degrade slightly with more negative context parameters. The AUC values confirm that all models are highly effective, though SynGuard’s perfect score suggests it may be tailored to this specific task. The random guess line underscores the importance of model selection, as even the weakest model (Word-S(Context)-0.7) outperforms chance by a wide margin. This visualization highlights the trade-offs in classifier design and the impact of contextual parameters on performance.