## Line Chart: Cross Sections of Prior Function
### Overview
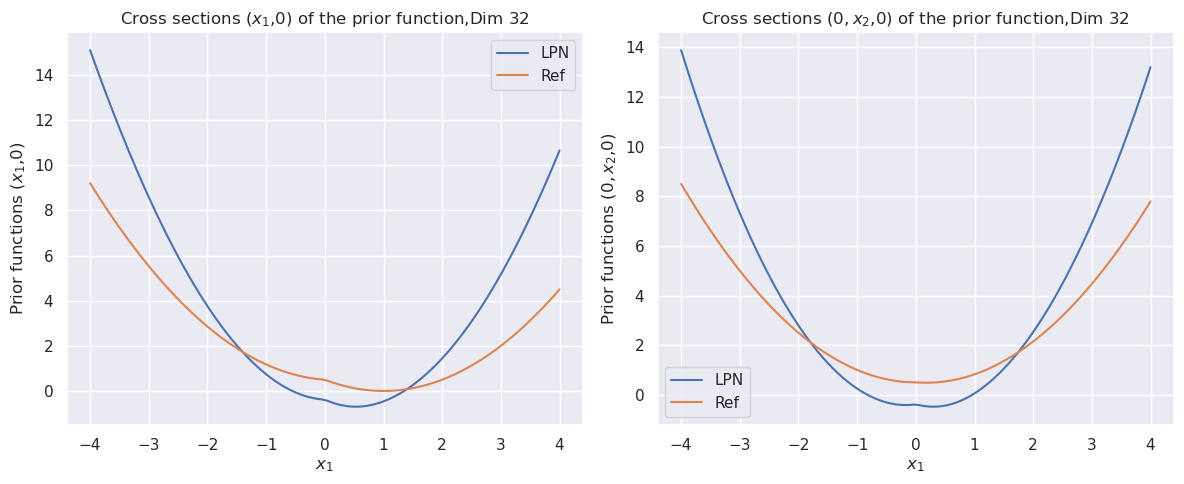
The image contains two line charts displayed side-by-side. Both charts depict cross-sections of a prior function in dimension 32. The left chart shows cross-sections (x1,0), while the right chart shows cross-sections (0, x2,0). Each chart plots two data series: "LPN" and "Ref". Both charts show a parabolic trend for both LPN and Ref, with LPN generally having higher values than Ref, especially at the extremes of the x-axis.
### Components/Axes
**Left Chart:**
* **Title:** Cross sections (x1,0) of the prior function, Dim 32
* **Y-axis:** Prior functions (x1,0), with scale from 0 to 14 in increments of 2.
* **X-axis:** x1, with scale from -4 to 4 in increments of 1.
* **Legend:** Located in the top-right corner.
* LPN (blue line)
* Ref (orange line)
**Right Chart:**
* **Title:** Cross sections (0, x2,0) of the prior function, Dim 32
* **Y-axis:** Prior functions (0, x2,0), with scale from 0 to 14 in increments of 2.
* **X-axis:** x1, with scale from -4 to 4 in increments of 1.
* **Legend:** Located in the bottom-left corner.
* LPN (blue line)
* Ref (orange line)
### Detailed Analysis
**Left Chart (x1,0):**
* **LPN (blue line):** The line forms a U-shape.
* At x1 = -4, Prior functions (x1,0) ≈ 15
* At x1 = -2, Prior functions (x1,0) ≈ 4
* At x1 = 0, Prior functions (x1,0) ≈ -0.5
* At x1 = 2, Prior functions (x1,0) ≈ 4
* At x1 = 4, Prior functions (x1,0) ≈ 11
* **Ref (orange line):** The line forms a U-shape.
* At x1 = -4, Prior functions (x1,0) ≈ 9
* At x1 = -2, Prior functions (x1,0) ≈ 2.5
* At x1 = 0, Prior functions (x1,0) ≈ 0.5
* At x1 = 2, Prior functions (x1,0) ≈ 0.5
* At x1 = 4, Prior functions (x1,0) ≈ 7.5
**Right Chart (0, x2,0):**
* **LPN (blue line):** The line forms a U-shape.
* At x1 = -4, Prior functions (0, x2,0) ≈ 14
* At x1 = -2, Prior functions (0, x2,0) ≈ 3
* At x1 = 0, Prior functions (0, x2,0) ≈ -0.5
* At x1 = 2, Prior functions (0, x2,0) ≈ 2
* At x1 = 4, Prior functions (0, x2,0) ≈ 13
* **Ref (orange line):** The line forms a U-shape.
* At x1 = -4, Prior functions (0, x2,0) ≈ 8.5
* At x1 = -2, Prior functions (0, x2,0) ≈ 2
* At x1 = 0, Prior functions (0, x2,0) ≈ 0.5
* At x1 = 2, Prior functions (0, x2,0) ≈ 0.5
* At x1 = 4, Prior functions (0, x2,0) ≈ 7.5
### Key Observations
* Both charts show similar trends for LPN and Ref, with a minimum value near x1 = 0.
* The LPN line has a steeper curve than the Ref line in both charts.
* The LPN values are generally higher than the Ref values, especially at the extremes of the x-axis.
* The minimum value for LPN is slightly negative in both charts.
### Interpretation
The charts compare the cross-sections of a prior function using two different methods, LPN and Ref. The parabolic shape suggests that the prior function has a quadratic component. The LPN method appears to produce a more pronounced curvature compared to the Ref method. The fact that the LPN values are generally higher than the Ref values, especially at the extremes, indicates that LPN might be more sensitive to changes in the input variables. The slight negative minimum value for LPN could be a result of the specific approximation or modeling technique used. The similarity between the (x1,0) and (0, x2,0) cross-sections suggests some symmetry in the prior function with respect to these variables.