\n
## Line Chart: Cross Sections of Prior Function
### Overview
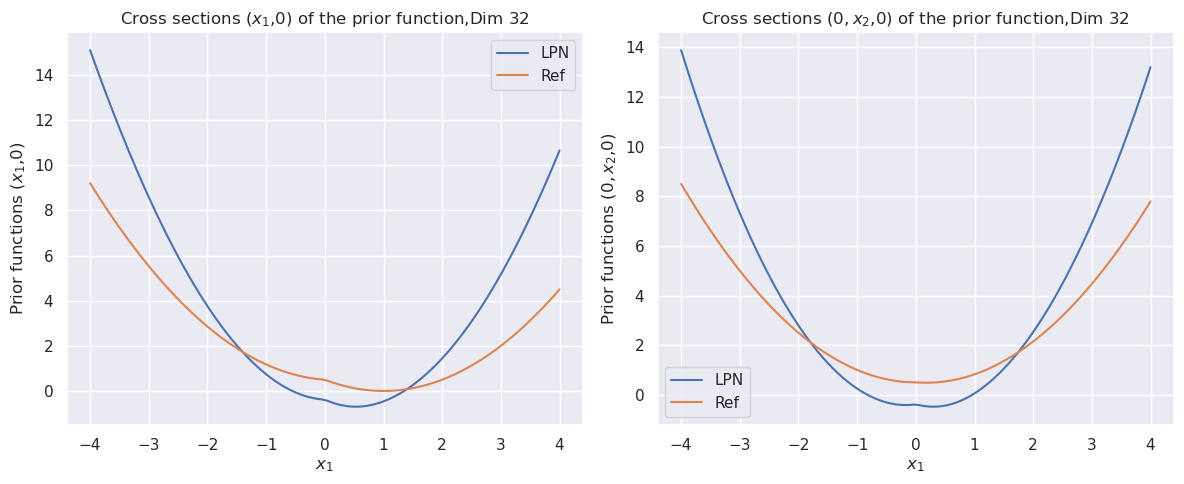
The image presents two line charts, side-by-side, visualizing cross-sections of a prior function in a 32-dimensional space. Both charts share the same x-axis scale but depict different cross-sections: the left chart shows the cross-section at (x1, 0), while the right chart shows the cross-section at (0, x2, 0). Each chart displays two lines representing different models: "LPN" (in blue) and "Ref" (in orange).
### Components/Axes
* **Title (Left Chart):** "Cross sections (x1,0) of the prior function,Dim 32"
* **Title (Right Chart):** "Cross sections (0, x2,0) of the prior function,Dim 32"
* **X-axis Label (Both Charts):** "x1"
* **Y-axis Label (Both Charts):** "Prior functions (x1,0)" (Left Chart) and "Prior functions (0, x2,0)" (Right Chart)
* **X-axis Scale (Both Charts):** -4 to 4
* **Y-axis Scale (Both Charts):** 0 to 14
* **Legend (Top-Right of each chart):**
* Blue Line: "LPN"
* Orange Line: "Ref"
### Detailed Analysis or Content Details
**Left Chart (Cross-section at (x1, 0))**
The blue "LPN" line exhibits a downward slope from x1 = -4 to approximately x1 = -1, reaching a minimum around x1 = -3. From x1 = -1 to x1 = 4, the line slopes upward, forming a parabolic shape.
* Approximate Data Points (LPN):
* x1 = -4, y ≈ 14.5
* x1 = -3, y ≈ 10.5
* x1 = -2, y ≈ 6.5
* x1 = -1, y ≈ 2.5
* x1 = 0, y ≈ 0.5
* x1 = 1, y ≈ 1.5
* x1 = 2, y ≈ 3.5
* x1 = 3, y ≈ 6.5
* x1 = 4, y ≈ 10.5
The orange "Ref" line shows a more symmetrical parabolic shape. It starts at approximately y = 0 at x1 = -4, reaches a minimum around x1 = 0, and then rises to approximately y = 0 at x1 = 4.
* Approximate Data Points (Ref):
* x1 = -4, y ≈ 0.2
* x1 = -3, y ≈ 1.2
* x1 = -2, y ≈ 2.2
* x1 = -1, y ≈ 3.2
* x1 = 0, y ≈ 4.2
* x1 = 1, y ≈ 3.2
* x1 = 2, y ≈ 2.2
* x1 = 3, y ≈ 1.2
* x1 = 4, y ≈ 0.2
**Right Chart (Cross-section at (0, x2, 0))**
The blue "LPN" line mirrors the shape of the left chart's LPN line, with a downward slope from x1 = -4 to approximately x1 = -1, and an upward slope from x1 = -1 to x1 = 4.
* Approximate Data Points (LPN):
* x1 = -4, y ≈ 13
* x1 = -3, y ≈ 9
* x1 = -2, y ≈ 5
* x1 = -1, y ≈ 1
* x1 = 0, y ≈ 0
* x1 = 1, y ≈ 1
* x1 = 2, y ≈ 5
* x1 = 3, y ≈ 9
* x1 = 4, y ≈ 13
The orange "Ref" line also mirrors the shape of the left chart's Ref line, exhibiting a symmetrical parabolic shape.
* Approximate Data Points (Ref):
* x1 = -4, y ≈ 0.2
* x1 = -3, y ≈ 1.2
* x1 = -2, y ≈ 2.2
* x1 = -1, y ≈ 3.2
* x1 = 0, y ≈ 4.2
* x1 = 1, y ≈ 3.2
* x1 = 2, y ≈ 2.2
* x1 = 3, y ≈ 1.2
* x1 = 4, y ≈ 0.2
### Key Observations
* Both charts show that the "LPN" model has a more pronounced asymmetry compared to the "Ref" model.
* The "Ref" model consistently exhibits a more symmetrical parabolic shape in both cross-sections.
* The "LPN" model's values are significantly higher than the "Ref" model's values for negative x1 values.
* The shapes of the curves are similar in both charts, suggesting a consistent behavior of the models across different cross-sections.
### Interpretation
The charts demonstrate the behavior of two different models ("LPN" and "Ref") when examining cross-sections of a 32-dimensional prior function. The asymmetry observed in the "LPN" model suggests that the prior distribution is not isotropic, meaning it doesn't assign equal probability to all directions in the 32-dimensional space. The "Ref" model, with its symmetrical parabolic shape, indicates a more isotropic prior.
The fact that the shapes are consistent across both cross-sections (x1, 0) and (0, x2, 0) suggests that the asymmetry is not specific to a particular direction but is a general characteristic of the "LPN" model's prior. The higher values of the "LPN" model for negative x1 values could indicate a preference for certain regions of the parameter space.
These differences in prior distributions could have significant implications for the performance of any subsequent models trained using these priors, potentially leading to biases or different exploration strategies during learning. The charts provide valuable insights into the characteristics of the prior distributions and their potential impact on downstream tasks.