## Line Graphs: Cross Sections of Prior Functions in 32-Dimensional Space
### Overview
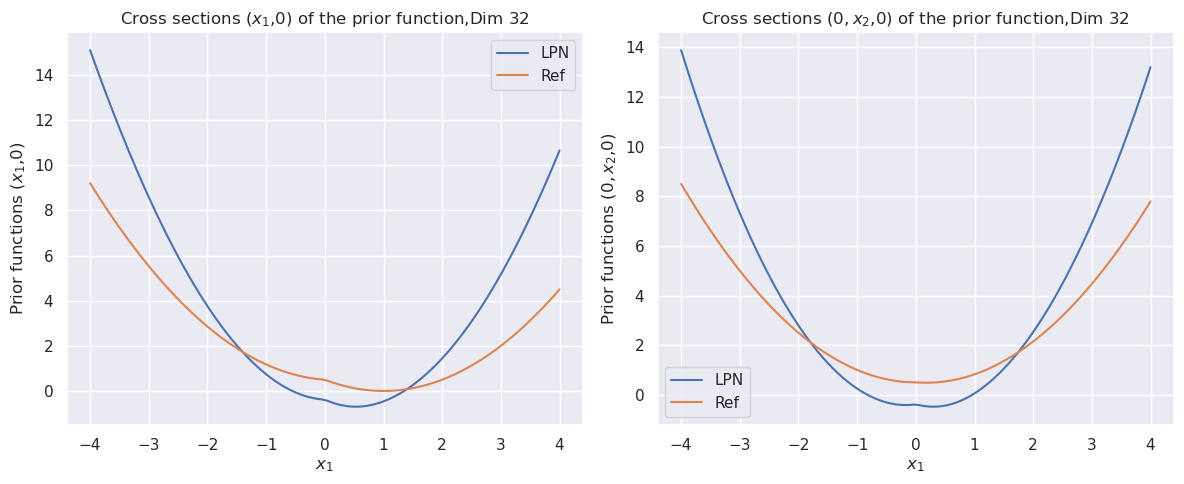
The image contains two side-by-side line graphs comparing "LPN" (blue) and "Ref" (orange) prior functions across two cross-sectional views of a 32-dimensional space. Both graphs share identical axes ranges (-4 to 4 on the x-axis) but differ in their y-axis labels, reflecting different dimensional perspectives.
### Components/Axes
- **Left Graph**:
- Title: "Cross sections (x₁,0) of the prior function, Dim 32"
- X-axis: Labeled "x₁" with ticks at -4, -3, -2, -1, 0, 1, 2, 3, 4
- Y-axis: Labeled "Prior functions (x₁,0)"
- Legend: Top-right corner, blue = "LPN", orange = "Ref"
- **Right Graph**:
- Title: "Cross sections (0, x₂, 0) of the prior function, Dim 32"
- X-axis: Labeled "x₁" with identical tick marks as the left graph
- Y-axis: Labeled "Prior functions (0, x₂, 0)"
- Legend: Top-right corner, same color coding as left graph
### Detailed Analysis
#### Left Graph (x₁,0 Cross-Section)
- **LPN (Blue)**:
- Starts at ~14.5 at x₁ = -4
- Dips to ~0.5 at x₁ = 0
- Rises to ~10.5 at x₁ = 4
- **Ref (Orange)**:
- Starts at ~9 at x₁ = -4
- Dips to ~0.5 at x₁ = 0
- Rises to ~4.5 at x₁ = 4
#### Right Graph (0, x₂, 0 Cross-Section)
- **LPN (Blue)**:
- Starts at ~14 at x₁ = -4
- Dips to ~0.5 at x₁ = 0
- Rises sharply to ~13.5 at x₁ = 4
- **Ref (Orange)**:
- Starts at ~9 at x₁ = -4
- Dips to ~0.5 at x₁ = 0
- Rises to ~8 at x₁ = 4
### Key Observations
1. **Symmetry**: Both graphs exhibit U-shaped curves, suggesting quadratic-like behavior in the prior functions.
2. **Divergence at Extremes**: LPN values are consistently higher than Ref values at x₁ = ±4 in both graphs.
3. **Convergence at Origin**: Both LPN and Ref lines intersect at their minimum point (~0.5) at x₁ = 0.
4. **Asymmetry in Right Graph**: The LPN line in the right graph rises more sharply than in the left graph, while the Ref line shows a more gradual increase.
### Interpretation
The graphs compare two prior functions (LPN and Ref) across two orthogonal cross-sections of a high-dimensional space. The LPN function demonstrates:
- **Higher sensitivity** to input values at the extremes (x₁ = ±4), with values exceeding Ref by ~50% in the right graph.
- **Stronger curvature** in the right graph, suggesting dimensional dependencies in the prior function's behavior.
- A **shared minimum** at x₁ = 0, indicating a common optimal point or constraint in both functions.
The Ref function appears to represent a baseline or reference model, while LPN may incorporate additional constraints or regularization terms that amplify its response at the boundaries of the input space. The dimensional perspective (x₁,0 vs. 0,x₂,0) reveals how the prior functions behave differently when varying specific dimensions in isolation.