## Diagram: Vector Basis and Lattice Grid
### Overview
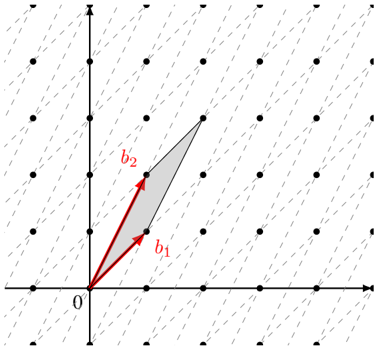
The image is a mathematical diagram illustrating two basis vectors, labeled **b₁** and **b₂**, originating from the origin of a coordinate system. These vectors define a parallelogram (shaded in light gray) on a background grid of lattice points connected by dashed diagonal lines. The diagram visually represents concepts from linear algebra or geometry, such as vector addition, linear independence, and area spanned by vectors.
### Components/Axes
* **Coordinate System:** A standard 2D Cartesian plane with a horizontal x-axis and a vertical y-axis. Both axes have arrowheads indicating the positive direction.
* **Origin:** The intersection of the axes is explicitly labeled with the numeral **"0"**.
* **Vectors:**
* **b₁:** A red vector starting at the origin (0,0) and pointing to the right and slightly upward. Its tip terminates at a lattice point.
* **b₂:** A red vector starting at the origin (0,0) and pointing more steeply upward and to the right. Its tip terminates at a different lattice point.
* Both vectors are labeled with their names (**b₁**, **b₂**) in red text placed near their midpoints.
* **Parallelogram:** A light gray, semi-transparent quadrilateral formed by the origin, the tip of **b₁**, the tip of **b₂**, and the point that is the vector sum of **b₁** and **b₂**. This shape represents the area spanned by the two basis vectors.
* **Lattice Grid:** The background consists of a regular array of black dots (lattice points). These points are interconnected by two sets of parallel dashed lines:
* One set runs diagonally from bottom-left to top-right.
* The other set runs diagonally from top-left to bottom-right.
This creates a diamond or rhombic tiling pattern across the entire plane.
### Detailed Analysis
* **Spatial Grounding & Vector Placement:**
* The origin **"0"** is at the bottom-left corner of the main diagram area, where the axes intersect.
* Vector **b₁** (red) extends from the origin to a lattice point located approximately **one unit right and one unit up** relative to the grid spacing.
* Vector **b₂** (red) extends from the origin to a lattice point located approximately **one unit right and two units up** relative to the grid spacing.
* The gray parallelogram's fourth vertex (opposite the origin) is at the lattice point that is the sum of the displacements of **b₁** and **b₂**, placing it approximately **two units right and three units up** from the origin.
* **Trend Verification (Geometric Relationship):** The two vectors are not collinear; they point in distinct directions, visually demonstrating linear independence. The parallelogram they form has a non-zero area, confirming they span a 2D space.
* **Component Isolation:**
* **Header/Top Region:** Contains the upper portion of the lattice grid and the positive y-axis.
* **Main Chart/Center Region:** Contains the origin, both labeled vectors (**b₁**, **b₂**), the shaded parallelogram, and the central lattice points.
* **Footer/Bottom Region:** Contains the positive x-axis and the lower portion of the lattice grid.
### Key Observations
1. **No Numerical Scales:** The axes lack numerical tick marks or titles beyond the origin label "0". All positional information is inferred relative to the lattice grid points.
2. **Lattice as Reference:** The dashed-line grid provides the only frame of reference for determining the approximate coordinates of the vector tips. The vectors terminate exactly on lattice points.
3. **Color Coding:** Red is used exclusively for the vectors and their labels (**b₁**, **b₂**), creating a clear visual association. Gray is used for the area of interest (the parallelogram). Black is used for the structural elements (axes, lattice points, dashed lines).
4. **Visual Emphasis:** The shaded parallelogram highlights the geometric concept of the area determined by the two basis vectors.
### Interpretation
This diagram is a pedagogical tool illustrating fundamental concepts in linear algebra and vector geometry.
* **What it Demonstrates:** It shows how two linearly independent vectors (**b₁** and **b₂**) can serve as a **basis** for a 2D plane. Any point in the plane can be reached by a linear combination of these two vectors. The shaded parallelogram represents the set of all points that can be expressed as a combination where the coefficients are between 0 and 1.
* **Relationship Between Elements:** The lattice grid likely represents the integer coordinate system (ℤ²). The vectors **b₁** and **b₂** define a new, non-orthogonal coordinate system. The parallelogram is the **fundamental domain** or **unit cell** for this new coordinate system. Translating this parallelogram by integer multiples of **b₁** and **b₂** would tile the entire plane, which is hinted at by the repeating lattice pattern.
* **Notable Implications:** The diagram visually argues that the **area** of the parallelogram (and thus the magnitude of the determinant of the matrix formed by **b₁** and **b₂**) is a key property of the basis. It also shows that the basis vectors are not necessarily aligned with the standard x-y axes, introducing the concept of a change of basis. The absence of specific numbers focuses the viewer on the geometric and relational properties rather than arithmetic calculation.