## Diagram: Vector Basis Representation
### Overview
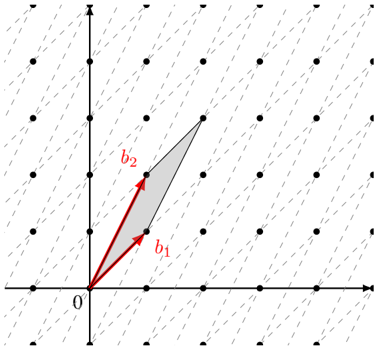
The image depicts a 2D coordinate system with two vectors originating from the origin (0,0). A shaded parallelogram is formed between the vectors, and a legend identifies their labels and colors. The axes are labeled "x" (horizontal) and "y" (vertical), with gridlines and tick marks.
### Components/Axes
- **Axes**:
- Horizontal axis labeled "x" with tick marks at integer intervals.
- Vertical axis labeled "y" with tick marks at integer intervals.
- **Vectors**:
- **b₁**: Red vector originating from (0,0), pointing diagonally upward to the right.
- **b₂**: Gray vector originating from (0,0), pointing diagonally upward to the left.
- **Legend**:
- Located in the **top-left corner** of the diagram.
- Labels:
- Red: "b₁"
- Gray: "b₂"
- **Shaded Region**:
- A parallelogram bounded by vectors **b₁** and **b₂**, shaded in light gray.
### Detailed Analysis
- **Vector Positions**:
- **b₁** extends approximately to coordinates (2,1) based on grid alignment.
- **b₂** extends approximately to coordinates (-1,2) based on grid alignment.
- **Shaded Parallelogram**:
- Formed by linear combinations of **b₁** and **b₂** (e.g., scalar multiples and vector addition).
- The shaded area represents the span of the vectors in the 2D plane.
- **Legend Placement**:
- The legend is positioned in the **top-left quadrant**, outside the main coordinate system.
### Key Observations
1. The vectors **b₁** and **b₂** are not orthogonal, as their directions differ by an acute angle.
2. The shaded parallelogram suggests the vectors form a basis for a 2D subspace.
3. The origin (0,0) is explicitly marked, confirming the vectors originate from this point.
### Interpretation
This diagram illustrates a **vector basis** in a 2D space. The shaded parallelogram represents all possible linear combinations of **b₁** and **b₂**, forming a subspace. The non-orthogonal orientation of the vectors indicates they span the plane but are not perpendicular. The legend’s placement ensures clarity in distinguishing the vectors’ identities. The diagram likely serves to demonstrate concepts in linear algebra, such as span, basis, or coordinate transformations.
**Note**: No numerical data or explicit equations are provided in the image. The analysis is based on geometric interpretation of the vectors and shaded region.