## Chart: Pass @N over Gemma 2B Base and Scaling Laws
### Overview
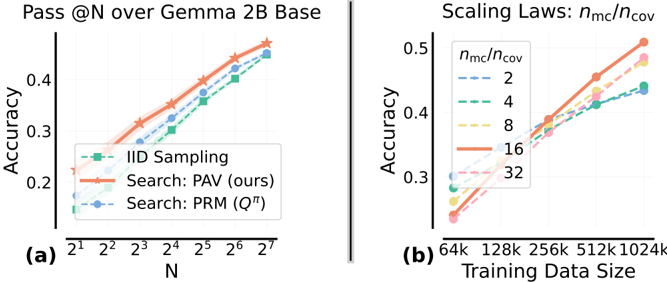
The image presents two line charts comparing the accuracy of different search methods and scaling laws over varying parameters. The left chart (a) shows the accuracy of "IID Sampling," "Search: PAV (ours)," and "Search: PRM (Q^π)" as a function of N, plotted on a log scale. The right chart (b) illustrates the scaling laws of accuracy with respect to training data size for different ratios of n_mc/n_cov.
### Components/Axes
**Chart (a): Pass @N over Gemma 2B Base**
* **Title:** Pass @N over Gemma 2B Base
* **X-axis:** N (values: 2^1, 2^2, 2^3, 2^4, 2^5, 2^6, 2^7)
* **Y-axis:** Accuracy (scale: 0.2 to 0.45, incrementing by 0.1)
* **Legend (bottom-right):**
* IID Sampling (green dashed line with square markers)
* Search: PAV (ours) (orange solid line with star markers)
* Search: PRM (Q^π) (blue dashed line with circle markers)
**Chart (b): Scaling Laws: n_mc/n_cov**
* **Title:** Scaling Laws: n_mc/n_cov
* **X-axis:** Training Data Size (values: 64k, 128k, 256k, 512k, 1024k)
* **Y-axis:** Accuracy (scale: 0.3 to 0.5, incrementing by 0.1)
* **Legend (top-left):** n_mc/n_cov
* 2 (light blue dashed line)
* 4 (green dashed line)
* 8 (yellow dashed line)
* 16 (orange solid line)
* 32 (pink dashed line)
### Detailed Analysis
**Chart (a): Pass @N over Gemma 2B Base**
* **IID Sampling (green):** The accuracy starts at approximately 0.15 at N=2^1 and increases to approximately 0.42 at N=2^7.
* **Search: PAV (ours) (orange):** The accuracy starts at approximately 0.22 at N=2^1 and increases to approximately 0.47 at N=2^7. This line also has a shaded region around it, indicating a confidence interval.
* **Search: PRM (Q^π) (blue):** The accuracy starts at approximately 0.17 at N=2^1 and increases to approximately 0.45 at N=2^7.
**Chart (b): Scaling Laws: n_mc/n_cov**
* **n_mc/n_cov = 2 (light blue):** The accuracy starts at approximately 0.30 at 64k and increases to approximately 0.39 at 1024k.
* **n_mc/n_cov = 4 (green):** The accuracy starts at approximately 0.28 at 64k and increases to approximately 0.42 at 1024k.
* **n_mc/n_cov = 8 (yellow):** The accuracy starts at approximately 0.25 at 64k and increases to approximately 0.41 at 1024k.
* **n_mc/n_cov = 16 (orange):** The accuracy starts at approximately 0.33 at 64k and increases to approximately 0.51 at 1024k.
* **n_mc/n_cov = 32 (pink):** The accuracy starts at approximately 0.23 at 64k and increases to approximately 0.47 at 1024k.
### Key Observations
* In chart (a), "Search: PAV (ours)" consistently outperforms "IID Sampling" and "Search: PRM (Q^π)" across all values of N.
* In chart (b), the scaling laws show that higher n_mc/n_cov ratios generally lead to higher accuracy, with n_mc/n_cov = 16 showing the highest accuracy across all training data sizes.
* In chart (b), the lines for n_mc/n_cov = 2, 4, and 8 are very close together, suggesting similar performance within that range.
### Interpretation
The charts suggest that the "Search: PAV (ours)" method is more effective than "IID Sampling" and "Search: PRM (Q^π)" for the given task, as it consistently achieves higher accuracy across different values of N. The scaling laws indicate that increasing the ratio of n_mc/n_cov can improve accuracy, but the effect plateaus or even decreases beyond a certain point (around n_mc/n_cov = 16). This implies that there is an optimal balance between these parameters for maximizing performance. The shaded region around the "Search: PAV (ours)" line in chart (a) indicates the uncertainty or variability in the accuracy of this method.