\n
## [Chart Type]: Dual-Panel Line Charts
### Overview
The image contains two side-by-side line charts, labeled (a) and (b), presenting performance metrics related to machine learning model evaluation and scaling. Both charts plot numerical relationships with multiple data series, using distinct colors and markers. The overall aesthetic is clean and academic, with a white background and light grid lines.
### Components/Axes
**Chart (a): Left Panel**
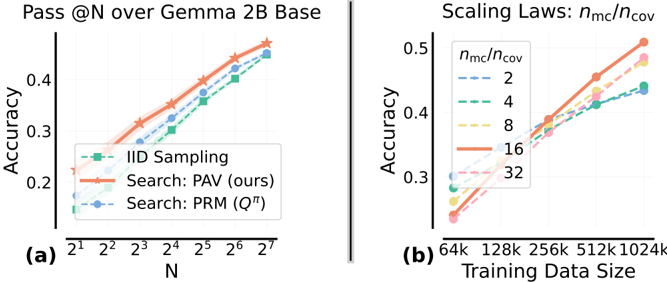
* **Title:** "Pass @N over Gemma 2B Base"
* **X-Axis:**
* **Label:** "N"
* **Scale:** Logarithmic base 2.
* **Markers/Ticks:** 2¹, 2², 2³, 2⁴, 2⁵, 2⁶, 2⁷.
* **Y-Axis:**
* **Label:** "Accuracy"
* **Scale:** Linear, from approximately 0.15 to 0.45.
* **Markers/Ticks:** 0.2, 0.3, 0.4.
* **Legend:** Located in the bottom-left corner of the plot area.
* **IID Sampling:** Green dashed line with square markers.
* **Search: PAV (ours):** Orange solid line with star markers.
* **Search: PRM (Q^π):** Blue dashed line with circle markers.
**Chart (b): Right Panel**
* **Title:** "Scaling Laws: n_mc/n_cov"
* **X-Axis:**
* **Label:** "Training Data Size"
* **Scale:** Logarithmic base 2.
* **Markers/Ticks:** 64k, 128k, 256k, 512k, 1024k.
* **Y-Axis:**
* **Label:** "n_mc/n_cov"
* **Scale:** Linear, from approximately 0.25 to 0.5.
* **Markers/Ticks:** 0.3, 0.4, 0.5.
* **Legend:** Located in the top-left corner of the plot area.
* **n_mc/n_cov = 2:** Blue dashed line.
* **n_mc/n_cov = 4:** Green dashed line.
* **n_mc/n_cov = 8:** Yellow dashed line.
* **n_mc/n_cov = 16:** Orange solid line.
* **n_mc/n_cov = 32:** Pink solid line.
### Detailed Analysis
**Chart (a) Data Points & Trends:**
* **Trend Verification:** All three lines show a clear, monotonic upward trend as N increases. The "Search: PAV (ours)" line is consistently the highest, followed by "Search: PRM (Q^π)", with "IID Sampling" being the lowest.
* **Approximate Data Points (Accuracy vs. N):**
* **IID Sampling (Green Squares):** Starts at ~0.17 (N=2¹), rises to ~0.22 (N=2³), ~0.30 (N=2⁵), and ends at ~0.42 (N=2⁷).
* **Search: PRM (Q^π) (Blue Circles):** Starts at ~0.20 (N=2¹), rises to ~0.28 (N=2³), ~0.36 (N=2⁵), and ends at ~0.44 (N=2⁷).
* **Search: PAV (ours) (Orange Stars):** Starts at ~0.23 (N=2¹), rises to ~0.32 (N=2³), ~0.40 (N=2⁵), and ends at ~0.46 (N=2⁷).
**Chart (b) Data Points & Trends:**
* **Trend Verification:** All five lines show a clear, monotonic upward trend as Training Data Size increases. The slope (rate of increase) appears steeper for higher values of n_mc/n_cov.
* **Approximate Data Points (n_mc/n_cov vs. Training Data Size):**
* **Ratio = 2 (Blue Dashed):** Starts at ~0.30 (64k), rises to ~0.35 (256k), ends at ~0.43 (1024k).
* **Ratio = 4 (Green Dashed):** Starts at ~0.29 (64k), rises to ~0.36 (256k), ends at ~0.44 (1024k).
* **Ratio = 8 (Yellow Dashed):** Starts at ~0.28 (64k), rises to ~0.38 (256k), ends at ~0.47 (1024k).
* **Ratio = 16 (Orange Solid):** Starts at ~0.27 (64k), rises to ~0.40 (256k), ends at ~0.50 (1024k).
* **Ratio = 32 (Pink Solid):** Starts at ~0.26 (64k), rises to ~0.39 (256k), ends at ~0.49 (1024k).
### Key Observations
1. **Performance Hierarchy (Chart a):** The proposed method "Search: PAV (ours)" demonstrates superior accuracy across all values of N compared to the baseline "IID Sampling" and the alternative "Search: PRM (Q^π)".
2. **Scaling Behavior (Chart b):** The metric `n_mc/n_cov` improves with more training data for all tested ratios. The improvement is more pronounced (steeper slope) for higher ratios (16, 32) compared to lower ratios (2, 4).
3. **Crossover Point (Chart b):** At the smallest data size (64k), lower ratios (2, 4) have a slightly higher `n_mc/n_cov` value than the highest ratio (32). However, by 256k data points, the higher ratios overtake the lower ones, indicating a scaling advantage.
4. **Consistency:** The use of consistent colors (e.g., orange for the best-performing series in both charts) aids in cross-referencing, though the metrics being plotted are different.
### Interpretation
The data presents two related narratives about improving model performance through search-based methods and scaling.
* **Chart (a) demonstrates methodological superiority.** It shows that for the task of "Pass @N" on the Gemma 2B Base model, employing the "PAV" search strategy yields a consistent and significant accuracy boost over both simple IID sampling and another search method (PRM). The advantage is maintained as the evaluation parameter N increases, suggesting the method is robust. This is a direct comparison of techniques.
* **Chart (b) explores a scaling law.** It investigates how the ratio `n_mc/n_cov` (likely representing a relationship between Monte Carlo samples and coverage or a similar concept) scales with training data volume. The key finding is that this ratio is not static; it improves with more data, and the rate of improvement itself scales with the ratio's value. The crossover suggests that investing in a higher `n_mc/n_cov` ratio is more beneficial when ample training data is available, while for data-scarce regimes, a lower ratio might be marginally better initially. This chart provides guidance for resource allocation in model training.
**Underlying Connection:** The two charts likely come from a study on improving language model capabilities through search and verification techniques. Chart (a) proves the effectiveness of a specific search algorithm (PAV), while chart (b) characterizes the fundamental scaling behavior of a core parameter (`n_mc/n_cov`) within such a system. Together, they argue for both the efficacy of the proposed method and provide insight into how its components should be tuned based on available data scale.