## Line Charts: Accuracy Scaling Analysis
### Overview
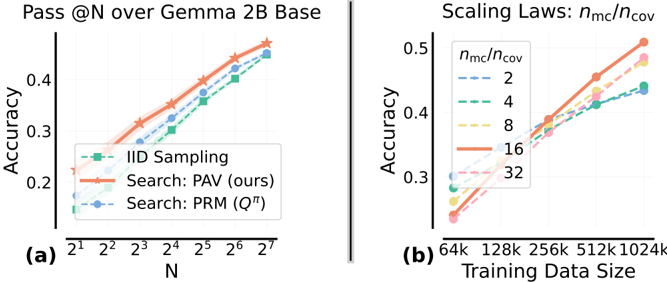
The image contains two line charts comparing different methods and scaling factors for accuracy performance. Chart (a) examines "Pass @N over Gemma 2B Base" across increasing N values, while chart (b) analyzes "Scaling Laws: n_mc/n_cov" across varying training data sizes. Both charts show upward trends in accuracy with different performance characteristics for each method.
### Components/Axes
**Chart (a):**
- **X-axis (N):** Logarithmic scale from 2¹ to 2⁷ (2 to 128)
- **Y-axis (Accuracy):** 0.2 to 0.5 range
- **Legend (bottom-left):**
- IID Sampling (green squares)
- Search: PAV (ours) (red stars)
- Search: PRM (Qπ) (blue circles)
**Chart (b):**
- **X-axis (Training Data Size):** 64k to 1024k (logarithmic spacing)
- **Y-axis (Accuracy):** 0.25 to 0.5 range
- **Legend (top-right):**
- n_mc/n_cov ratios: 2 (blue dotted), 4 (green dash), 8 (yellow dash-dot), 16 (red solid), 32 (pink dashed)
### Detailed Analysis
**Chart (a) Trends:**
1. **IID Sampling (green):** Starts at ~0.22 accuracy at N=2, reaches ~0.38 at N=128
2. **PAV (red):** Begins at ~0.24, peaks at ~0.42 (highest performance)
3. **PRM (blue):** Starts at ~0.20, ends at ~0.36
**Chart (b) Trends:**
1. **n_mc/n_cov=16 (red):** Highest accuracy (~0.48 at 1024k)
2. **n_mc/n_cov=32 (pink):** Second highest (~0.46 at 1024k)
3. **n_mc/n_cov=8 (yellow):** ~0.42 at 1024k
4. **n_mc/n_cov=4 (green):** ~0.38 at 1024k
5. **n_mc/n_cov=2 (blue):** ~0.34 at 1024k
### Key Observations
1. **PAV Superiority:** In chart (a), PAV consistently outperforms other methods across all N values
2. **Scaling Efficiency:** Higher n_mc/n_cov ratios show better accuracy gains with increased training data
3. **Diminishing Returns:** All methods show reduced improvement rates at higher N/training data values
4. **Performance Gaps:** PAV maintains ~0.04-0.06 accuracy advantage over PRM in chart (a)
### Interpretation
The data demonstrates that:
1. **Search Methods Outperform IID:** Both PAV and PRM significantly outperform random IID sampling, with PAV showing the strongest performance
2. **Scaling Benefits:** Higher n_mc/n_cov ratios (16-32) yield better accuracy, particularly with larger datasets (>512k)
3. **Method Robustness:** PAV maintains consistent performance across different N values, suggesting better generalization
4. **Training Data Impact:** Accuracy improvements plateau at ~1024k training data for all scaling ratios
The results suggest that PAV search methodology provides optimal performance for Gemma 2B base model, while higher n_mc/n_cov ratios (16-32) offer the best scaling efficiency for model training. The diminishing returns observed at higher N/training data values indicate potential optimization opportunities in both search methodology and scaling parameters.