\n
## Diagram: LLM Thinking States vs. Chain-of-Thought
### Overview
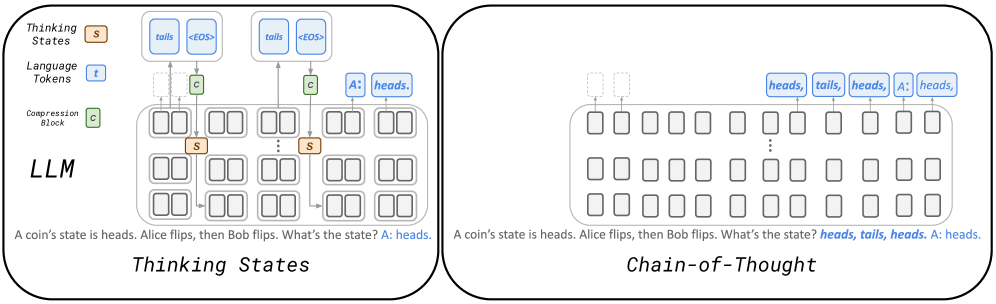
The image presents a comparative diagram illustrating two approaches within a Large Language Model (LLM): "Thinking States" and "Chain-of-Thought." Both diagrams depict the internal processing of a simple coin flip scenario ("A coin state is heads. Alice flips, then Bob flips. What's the state? A: heads."). The diagrams use a block-based representation to visualize the flow of information through the LLM.
### Components/Axes
The diagram is divided into two main sections, each representing a different approach. Each section contains:
* **LLM Block:** A large rectangular block labeled "LLM" representing the language model itself.
* **Thinking States/Chain-of-Thought Labels:** Labels indicating the specific approach being visualized.
* **Thinking States/Language Tokens/Compression Block:** Labels for the different layers of processing within the LLM.
* **Input Text:** The prompt "A coin state is heads. Alice flips, then Bob flips. What's the state? A: heads." is present below each diagram.
* **Blocks:** Smaller rectangular blocks within the LLM block, representing internal states or computations.
* **Arrows:** Arrows indicating the flow of information between blocks.
* **Labels within Blocks:** Text labels within the blocks, such as "tails", "heads", "<EOS>", "s", "c", and "A".
### Detailed Analysis or Content Details
**Thinking States Diagram (Left Side):**
* **Thinking States Layer:** Contains blocks labeled "s" (approximately 6x4 grid). Two blocks are highlighted in orange.
* **Language Tokens Layer:** Contains blocks labeled "t" (approximately 6x4 grid).
* **Compression Block Layer:** Contains blocks labeled "c" (approximately 6x4 grid).
* **Flow:** The flow starts with "tails" and "<EOS>" entering the Thinking States layer. These values propagate through the Compression Block layer, then to the Language Tokens layer. The final output is "A: heads."
* **Input:** "A coin state is heads. Alice flips, then Bob flips. What's the state? A: heads."
**Chain-of-Thought Diagram (Right Side):**
* **LLM Block:** Contains a grid of blocks (approximately 6x8).
* **Flow:** The flow starts with "heads", "tails", "heads", "heads" entering the LLM block. These values propagate through the block grid. The final output is "A: heads."
* **Input:** "A coin state is heads. Alice flips, then Bob flips. What's the state? A: heads."
### Key Observations
* **Thinking States:** Appears to compress information into a smaller "Thinking States" representation before generating the final answer. The orange highlighted blocks suggest a focus on specific states.
* **Chain-of-Thought:** Shows a more direct flow of information, with intermediate states ("heads", "tails", "heads", "heads") being explicitly represented within the LLM.
* **Output Consistency:** Both approaches arrive at the same answer ("A: heads.").
* **Visual Complexity:** The Chain-of-Thought diagram appears more visually complex, with more blocks and a longer flow path.
### Interpretation
The diagram illustrates two different strategies for how an LLM might approach a reasoning task. "Thinking States" suggests a compression-based approach, where the LLM first reduces the input into a more compact internal representation before generating the output. "Chain-of-Thought" demonstrates a more explicit reasoning process, where the LLM maintains a record of intermediate states and steps.
The fact that both approaches yield the same result suggests that both are capable of solving the problem, but they do so in different ways. The Chain-of-Thought approach might be more interpretable, as it explicitly shows the reasoning steps, while the Thinking States approach might be more efficient in terms of computational resources.
The diagram highlights the internal workings of LLMs and how they can be designed to perform reasoning tasks. It suggests that there are multiple ways to achieve the same result, and the choice of approach can have implications for efficiency, interpretability, and other factors. The diagram is a conceptual illustration and does not provide specific numerical data or performance metrics. It is a qualitative comparison of two different architectural approaches.