# Technical Document Extraction: Diagram Analysis
## Diagram Overview
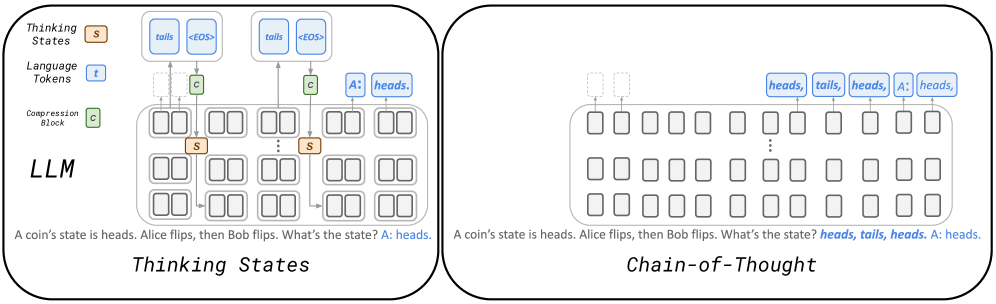
The image contains two side-by-side diagrams labeled **"Thinking States"** (left) and **"Chain-of-Thought"** (right). Both diagrams use grid-based structures to represent sequential processes, with annotations and legends to clarify components.
---
### **Left Diagram: Thinking States**
#### **Components and Labels**
1. **Legend**:
- **Thinking States**: Orange (`s`)
- **Language Tokens**: Blue (`t`)
- **Compression Block**: Green (`c`)
2. **Grid Structure**:
- A 5x4 grid of rectangles, with some cells containing labels:
- **Top Row**:
- Two cells labeled `tails` and `EOS` (blue background).
- Two cells labeled `tails` and `EOS` (blue background).
- **Middle Row**:
- One cell labeled `s` (orange, "Thinking States").
- One cell labeled `s` (orange, "Thinking States").
- **Right Column**:
- One cell labeled `A: heads.` (blue, "Language Tokens").
- **Bottom Row**:
- Multiple empty cells.
3. **Embedded Text**:
- Scenario: *"A coin's state is heads. Alice flips, then Bob flips. What's the state? A: heads."*
#### **Spatial Grounding**
- **Legend Position**: Top-left corner.
- **Color Consistency**:
- Orange (`s`) matches "Thinking States."
- Blue (`t`) matches "Language Tokens."
- Green (`c`) matches "Compression Block."
---
### **Right Diagram: Chain-of-Thought**
#### **Components and Labels**
1. **Legend**:
- **Language Tokens**: Blue (`t`)
- **A: heads.**: Blue (`A`)
2. **Grid Structure**:
- A 5x4 grid of rectangles, with sequential labels:
- **Top Row**:
- Labels: `heads, tails, heads, A: heads.` (blue).
- **Middle Row**:
- Labels: `heads, tails, heads, A: heads.` (blue).
- **Bottom Row**:
- Labels: `heads, tails, heads, A: heads.` (blue).
3. **Embedded Text**:
- Scenario: *"A coin's state is heads. Alice flips, then Bob flips. What's the state? heads, tails, heads. A: heads."*
#### **Spatial Grounding**
- **Legend Position**: Top-left corner.
- **Color Consistency**:
- Blue (`t`) matches "Language Tokens."
- Blue (`A`) matches "A: heads."
---
### **Key Observations**
1. **Purpose**:
- Both diagrams illustrate sequential reasoning processes, likely for a language model (LLM).
- "Thinking States" emphasizes intermediate states (e.g., `tails`, `EOS`), while "Chain-of-Thought" focuses on step-by-step outputs (e.g., `heads, tails`).
2. **Textual Content**:
- Both diagrams include the same scenario text but differ in how labels are applied to the grid.
3. **No Numerical Data**:
- The diagrams do not contain charts, heatmaps, or numerical trends. They are purely structural representations.
---
### **Conclusion**
The diagrams visualize two reasoning frameworks:
- **Thinking States**: Highlights intermediate states and compression blocks.
- **Chain-of-Thought**: Focuses on sequential outputs (e.g., coin flip results).
Both use color-coded legends to distinguish components, with spatial grounding ensuring clarity in label placement.