# Technical Document Extraction: Task Accuracy vs. Task Length
## 1. Component Isolation
* **Header/Title:** None present in the image.
* **Main Chart Area:** A line graph plotted on a Cartesian coordinate system with a grid.
* **Axes:**
* **Y-Axis (Vertical):** Labeled "Task Accuracy". Scale ranges from 0.0 to 1.0 with major ticks every 0.2.
* **X-Axis (Horizontal):** Labeled "Task Length". Scale ranges from 0 to 100 with major ticks every 20.
* **Footer/Legend:** Located at the bottom of the image, below the X-axis label. It contains four color-coded categories.
---
## 2. Legend and Data Series Identification
The legend is positioned at the bottom center of the image.
| Color | Label | Visual Trend Description |
| :--- | :--- | :--- |
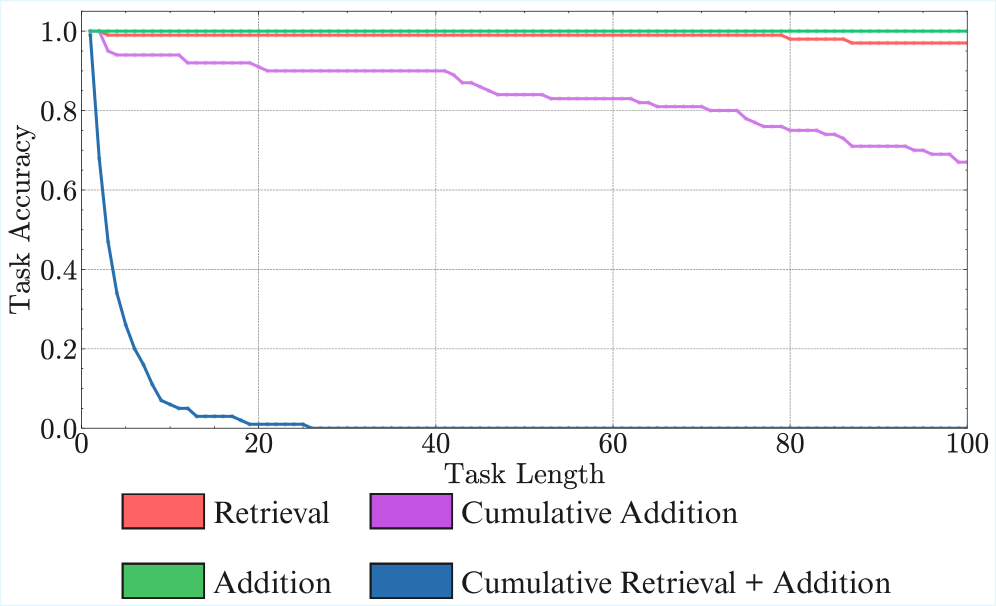
| **Red** | **Retrieval** | Maintains a constant accuracy of 1.0 until approximately Task Length 80, where it drops slightly to ~0.98 and remains flat. |
| **Green** | **Addition** | Maintains a perfectly flat, constant accuracy of 1.0 across the entire range (0 to 100). |
| **Purple** | **Cumulative Addition** | Shows a "staircase" downward trend. Starts at 1.0, drops to ~0.95 early, stays flat, drops to ~0.90 at length 20, ~0.83 at length 50, and continues a staggered decline to ~0.68 at length 100. |
| **Blue** | **Cumulative Retrieval + Addition** | Shows a sharp exponential decay. Starts at 1.0 at length 0 and crashes to near 0.0 by Task Length 25, remaining at 0.0 for the rest of the chart. |
---
## 3. Data Extraction and Key Trends
### Axis Markers
* **Y-Axis:** 0.0, 0.2, 0.4, 0.6, 0.8, 1.0
* **X-Axis:** 0, 20, 40, 60, 80, 100
### Detailed Data Points (Estimated from Grid)
| Task Length | Retrieval (Red) | Addition (Green) | Cumulative Addition (Purple) | Cumulative Retrieval + Addition (Blue) |
| :--- | :--- | :--- | :--- | :--- |
| **0** | 1.0 | 1.0 | 1.0 | 1.0 |
| **10** | 1.0 | 1.0 | 0.94 | 0.08 |
| **20** | 1.0 | 1.0 | 0.90 | 0.01 |
| **40** | 1.0 | 1.0 | 0.90 | 0.00 |
| **60** | 1.0 | 1.0 | 0.83 | 0.00 |
| **80** | 0.98 | 1.0 | 0.75 | 0.00 |
| **100** | 0.98 | 1.0 | 0.68 | 0.00 |
---
## 4. Technical Analysis of Trends
1. **Stability of Simple Tasks:** Both "Addition" (Green) and "Retrieval" (Red) demonstrate high resilience to task length, maintaining near-perfect accuracy (1.0) throughout the sequence.
2. **Complexity Penalty:** The "Cumulative Addition" (Purple) task shows that as the length of the sequence increases, the accuracy degrades in a step-wise fashion, suggesting a cumulative error or memory strain that increases every 10-20 units of task length.
3. **Critical Failure Point:** The "Cumulative Retrieval + Addition" (Blue) task represents a catastrophic failure mode. The system's ability to perform this combined task effectively vanishes once the task length exceeds 20 units. The most significant drop occurs between length 0 and 10, where accuracy falls by over 90%.
## 5. Language Declaration
The text in this image is entirely in **English**. No other languages were detected.