# Technical Document Analysis: Task Accuracy vs. Task Length
## 1. Chart Type and Structure
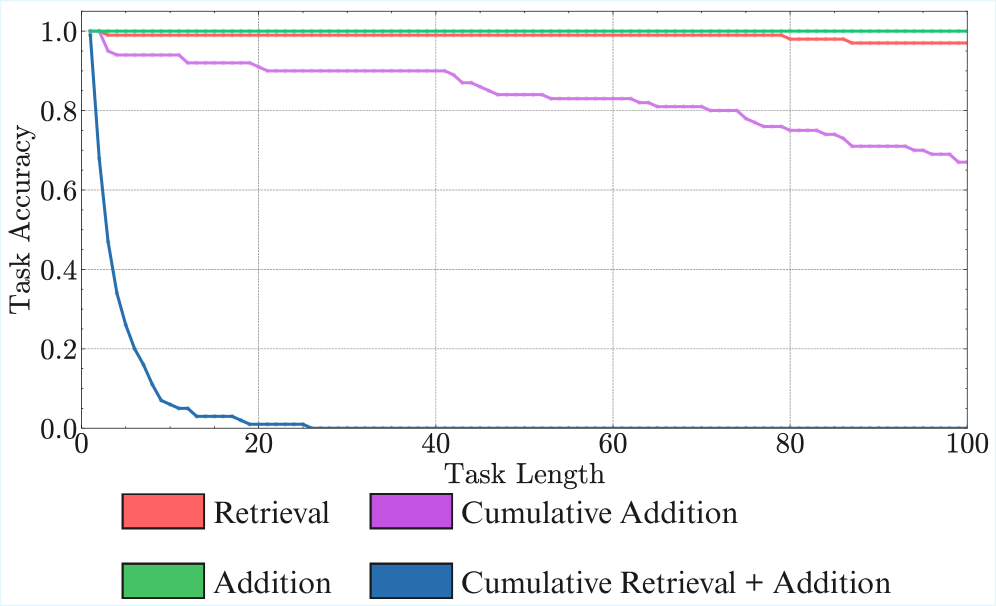
- **Chart Type**: Line graph
- **Components**:
- **X-axis**: Task Length (0–100)
- **Y-axis**: Task Accuracy (0.0–1.0)
- **Legend**: Located at the bottom of the chart
- **Lines**: Four distinct data series with unique styles/colors
## 2. Axis Labels and Markers
- **X-axis**:
- Label: "Task Length"
- Ticks: 0, 20, 40, 60, 80, 100
- **Y-axis**:
- Label: "Task Accuracy"
- Ticks: 0.0, 0.2, 0.4, 0.6, 0.8, 1.0
## 3. Legend Details
- **Position**: Bottom center of the chart
- **Entries**:
- **Red Dashed Line**: Retrieval
- **Purple Dash-Dot Line**: Cumulative Addition
- **Green Dotted Line**: Addition
- **Blue Solid Line**: Cumulative Retrieval + Addition
## 4. Data Series Analysis
### 4.1 Retrieval (Red Dashed Line)
- **Trend**: Flat line at 1.0 across all Task Length values
- **Key Points**:
- [0, 1.0], [20, 1.0], [40, 1.0], [60, 1.0], [80, 1.0], [100, 1.0]
### 4.2 Cumulative Addition (Purple Dash-Dot Line)
- **Trend**: Gradual decline from 1.0 to ~0.65
- **Key Points**:
- [0, 1.0]
- [20, ~0.92]
- [40, ~0.88]
- [60, ~0.83]
- [80, ~0.77]
- [100, ~0.68]
### 4.3 Addition (Green Dotted Line)
- **Trend**: Flat line at 1.0 across all Task Length values
- **Key Points**:
- [0, 1.0], [20, 1.0], [40, 1.0], [60, 1.0], [80, 1.0], [100, 1.0]
### 4.4 Cumulative Retrieval + Addition (Blue Solid Line)
- **Trend**: Sharp initial drop to 0, then flat
- **Key Points**:
- [0, 1.0]
- [10, 0.0]
- [20, 0.0]
- [40, 0.0]
- [60, 0.0]
- [80, 0.0]
- [100, 0.0]
## 5. Cross-Referenced Observations
- **Color Consistency**:
- Red dashed line matches "Retrieval" legend entry
- Purple dash-dot line matches "Cumulative Addition" legend entry
- Green dotted line matches "Addition" legend entry
- Blue solid line matches "Cumulative Retrieval + Addition" legend entry
- **Trend Verification**:
- All flat lines (Retrieval, Addition) maintain 1.0 accuracy
- Cumulative Addition shows stepwise degradation
- Cumulative Retrieval + Addition exhibits catastrophic failure at Task Length = 10
## 6. Spatial Grounding
- **Legend Coordinates**: Bottom center (exact [x, y] unspecified but visually centered)
- **Line Placement**:
- Top: Retrieval (red) and Addition (green)
- Middle: Cumulative Addition (purple)
- Bottom: Cumulative Retrieval + Addition (blue)
## 7. Critical Insights
- **Task Length Thresholds**:
- Cumulative Retrieval + Addition fails completely after Task Length = 10
- Cumulative Addition degrades by ~35% over Task Length = 100
- **Performance Parity**:
- Retrieval and Addition tasks maintain perfect accuracy
- Combined task (Cumulative Retrieval + Addition) shows non-linear failure
## 8. Missing Elements
- No textual annotations or annotations on data points
- No gridlines visible in the chart
- No secondary y-axis or annotations
## 9. Language Analysis
- **Primary Language**: English (all labels, axis titles, and legend entries)
- **No Foreign Text Detected**
## 10. Summary
The chart demonstrates task accuracy degradation under increasing task length. Retrieval and Addition tasks maintain perfect accuracy, while cumulative tasks exhibit failure modes:
1. **Cumulative Retrieval + Addition**: Catastrophic failure at Task Length = 10
2. **Cumulative Addition**: Gradual degradation over Task Length = 100