\n
## Bar Chart: Relative Improvement (RI) by Answer Type
### Overview
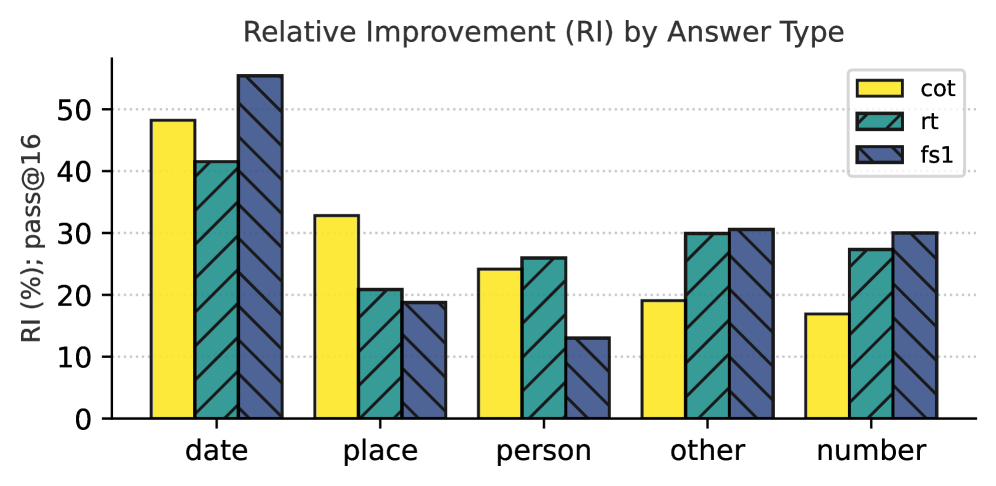
This bar chart displays the relative improvement (RI) in percentage (%) for different answer types (date, place, person, other, number) across three different methods: Chain-of-Thought (cot), Retrieval-augmented generation (rt), and Fine-tuned Self-Instruct (fs1). The performance metric is "pass@16".
### Components/Axes
* **Title:** "Relative Improvement (RI) by Answer Type"
* **X-axis:** Answer Type (date, place, person, other, number)
* **Y-axis:** RI (%) ; pass@16 (Scale from 0 to 60, increments of 10)
* **Legend:**
* cot (Yellow)
* rt (Light Blue/Teal)
* fs1 (Dark Blue/Navy)
### Detailed Analysis
The chart consists of five groups of three bars, one for each answer type and method.
**Date:**
* cot: Approximately 48%
* rt: Approximately 42%
* fs1: Approximately 55%
* Trend: fs1 shows the highest improvement, followed by cot, then rt.
**Place:**
* cot: Approximately 32%
* rt: Approximately 20%
* fs1: Approximately 26%
* Trend: cot shows the highest improvement, followed by fs1, then rt.
**Person:**
* cot: Approximately 22%
* rt: Approximately 25%
* fs1: Approximately 12%
* Trend: rt shows the highest improvement, followed by cot, then fs1.
**Other:**
* cot: Approximately 20%
* rt: Approximately 30%
* fs1: Approximately 30%
* Trend: rt and fs1 show the highest improvement, followed by cot.
**Number:**
* cot: Approximately 16%
* rt: Approximately 24%
* fs1: Approximately 26%
* Trend: fs1 shows the highest improvement, followed by rt, then cot.
### Key Observations
* The "fs1" method consistently performs well, achieving the highest relative improvement for "date", "number", and being tied for highest on "other".
* The "cot" method shows strong performance for "date" and "place".
* The "rt" method performs best for "person" and ties for best on "other".
* The relative improvement varies significantly depending on the answer type.
### Interpretation
The data suggests that the effectiveness of different methods for improving answer accuracy depends on the type of question being asked. "fs1" appears to be a robust method across multiple answer types, while "cot" and "rt" excel in specific areas. This indicates that a hybrid approach, leveraging the strengths of each method based on the answer type, might yield the best overall results. The "pass@16" metric suggests that these improvements are statistically significant, as they represent the percentage of times the correct answer is within the top 16 generated responses. The large differences in RI across answer types suggest that the underlying challenges of each type (e.g., identifying dates vs. understanding relationships between people) require different strategies for improvement. The chart provides valuable insights for optimizing question-answering systems by tailoring the method to the specific task.